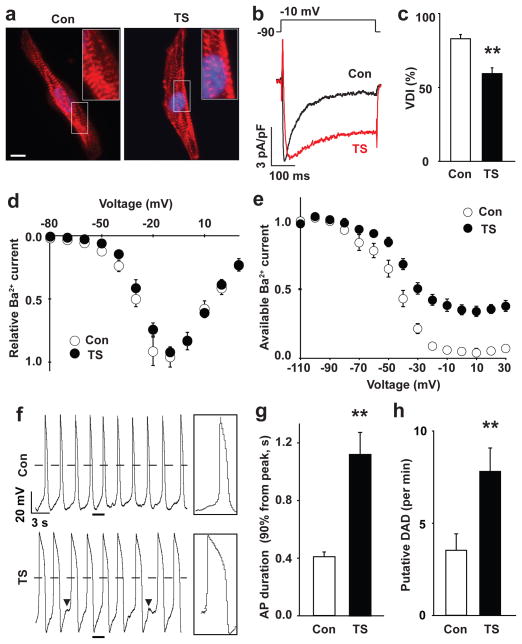
Figure 2. Electrophysiological features of TS cardiomyocytes.
a) Immunocytochemistry of human cardiomyocytes (CMs) generated from control (left) and TS iPSCs (right) using anti-α-Actinin antibodies (red). The nuclei (blue) are marked by Hoechst staining. Insets show high magnification images of the sarcomeres. Scale bar, 10 μm. b) Voltage-clamp recording of Ba2+ currents in control (black) and TS (red) CMs show a defect in voltage-dependent channel inactivation (VDI) following a voltage pulse from −90 to −10 mV. c) VDI in control and TS CMs 350 ms after the start of the pulse (**P<0.01; students T test). d) The IV relationship of TS (●) and control (○) Ca2+ currents (mean ± s.e.m.) are statistically identical. There were no significant differences in the peak amplitude of Ba2+ currents between control and TS CMs (data not shown). e) Ba2+ current in control and TS myocytes stimulated with a test pulse to +10 mV following a family of prepulses from −110 to +30 mV in 10 mV increments (raw traces in Supplementary Fig. 4c, control, n=23 cells in 4 lines; TS, n=19 in 4 lines, mean ± s.e.m.). f) Spontaneous action potentials (AP) in control and TS ventricular-like myocytes measured in current-clamp mode. Boxes show the regions indicated by underlines at an expanded time scale. Arrowheads show putative delayed afterdepolarizations (DADs). Dashed lines show 0 mV. g) AP duration in TS and control ventricular CMs. The expression of the ventricular marker, MLC2v, was confirmed with single-cell RT-PCR immediately after whole-cell patch recording (Supplementary Fig. 5). h) Putative DADs in TS and control ventricular-like cardiomyocytes (control, n=22 cells in 4 lines; TS, n=14 in 4 lines, mean ± s.e.m.). Statistical analyses were performed with Student’s t-test (**P<0.01).

