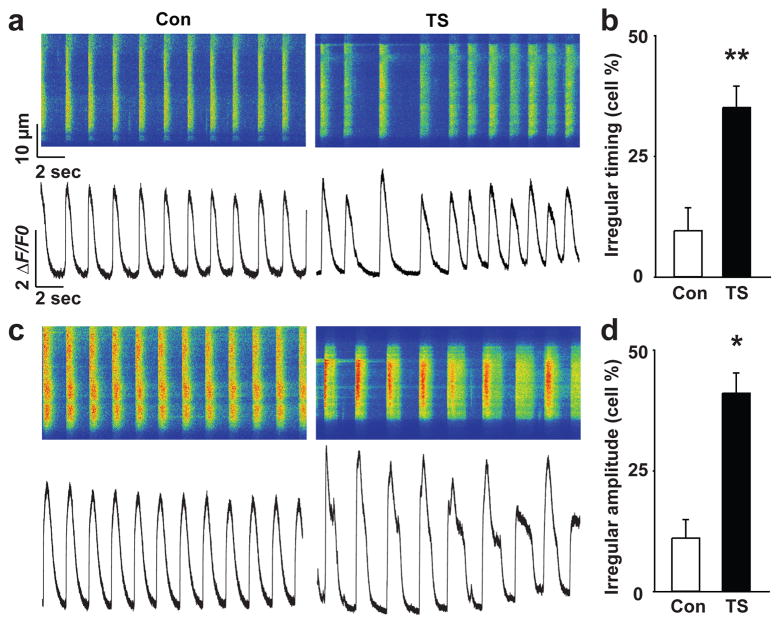
Figure 3. Ca2+ signaling in TS and control cardiomyocytes.
Representative line-scan images (a, c, top) and spontaneous Ca2+ transients (a, c, bottom) in control (left) and TS CMs (right). TS CMs showed more irregular timing (b) and amplitude (d) of spontaneous Ca2+ transients compared to control cells (see Supplementary Fig. 6 and Methods for details about the analysis, control, n=102 cells in 4 lines; TS, n=149 in 4 lines, mean ± s.e.m.; *P<0.05, **P<0.01., students T-test).

