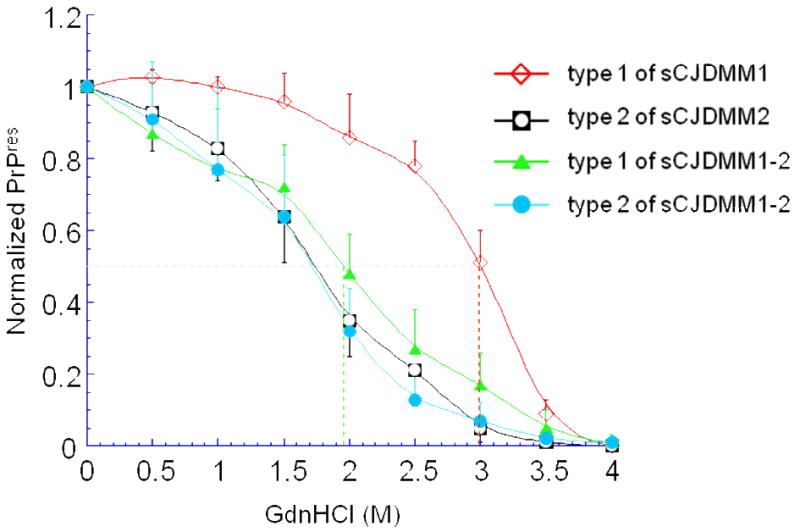
Figure 4. Conformation stability immunoassay (CSI) of the unglycosylated isoform of PrPSc from sCJDMM1, sCJDMM2 and sCJDMM1-2.

To measure the stability of PrPSc, increasing concentrations of GdnHCl are used to unfold PrPSc, which in turn becomes progressively more sensitive to digestion with PK. The concentration of guanidine applied to achieve the digestion of 50% of the PrPSc with proteinase K (PK) is indicated by [GdnHCl]1/2 (shown by the vertical color coded broken lines). The CSI curve shows that the stability of the PrPSc type 1 when it is present alone as in sCJDMM1 (red hollow diamond) is significantly different from the stability that it shows when it co-occurs with PrPSc type 2 as in sCJDMM1-2 (green solid triangle) ([GdnHCl]1/2 values 2.96M vs. 1.96M, respectively; p<10-5). Furthermore, the CSI curve of the PrPSc type 1 from sCJDMM1-2 becomes indistinguishable from that of PrPSc type 2 from sCJDMM2 (black square with hollow circle) and sCJDMM1-2 (blue solid circle), which are similar indicating no change in CSI characteristics between PrPSc 2 when alone or co-occurring with type 1. CSI profiles are smooth curves best matching data (mean ± SD) obtained at different concentrations of guanidine.
