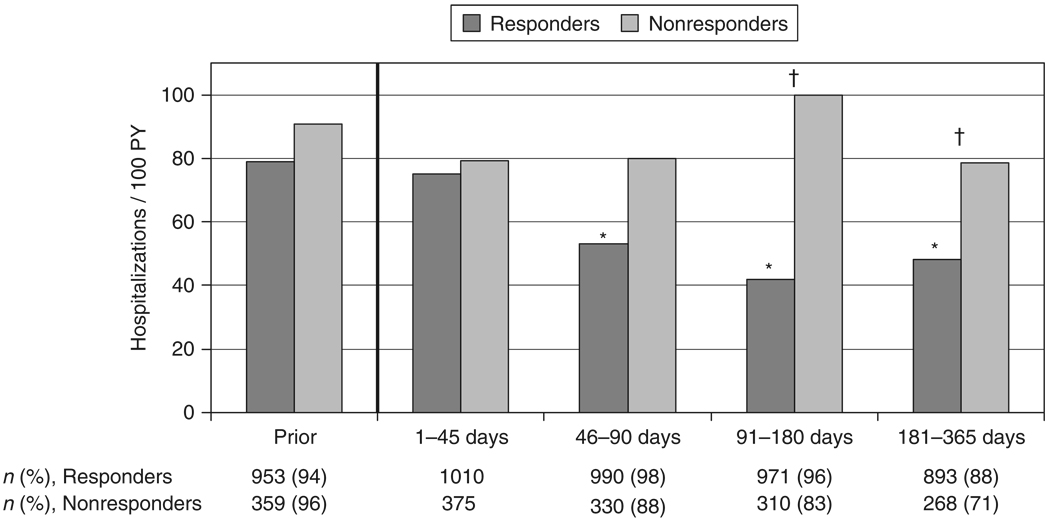
Fig. 1.
Hospitalization rates for virological responders and nonresponders prior to and over the first year following highly active antiretroviral therapy (HAART) initiation. *Indicates P < 0.05 for the relative rate (RR) vs. days 1–45 for responders; †indicates P < 0.05 for the RR for responders vs. nonresponders within the time period. ‘Prior’ is 180 days preceding HAART initiation. n, number of persons observed within each time period. PY, person-years.

