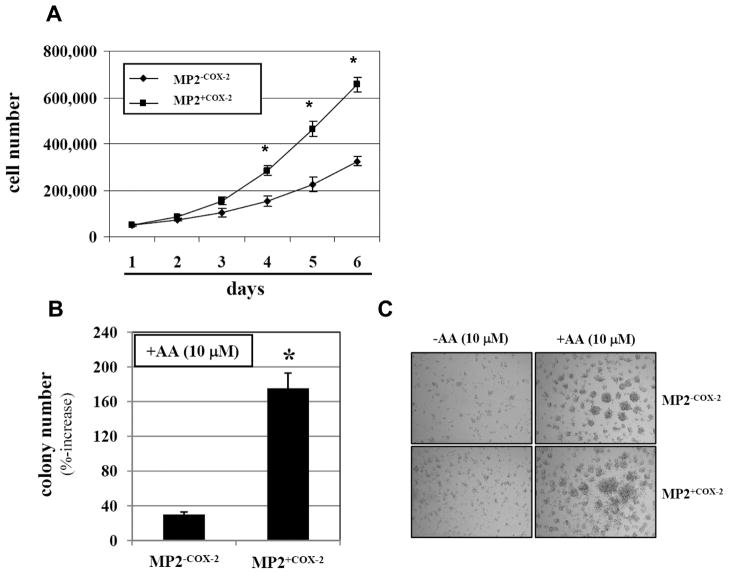
Figure 4. Anchorage-dependent and –independent growth of MP2+COX2 and MP2+COX2 cells.
A, MP2+COX2 and MP2−COX2 cells were treated with 10 μM arachidonic acid for 6 days, and anchorage-dependent cell proliferation were measured by cell count. Results are representative of three independent experiments and are presented as mean±SD (bars). *p<0.01 vs. MP2−COX2.
B, Anchorage-independent cell growth of MP2+COX2 and MP2−COX2 cells was measured by in 3D collagen cell culture system. Results are representative of three independent experiments and are presented as means ± SD (bars). *p<0.01 vs. MP2−COX2.
C, Representative images of colony formation. Top panel, MP2−COX2 cells; bottom panel, MP2+COX2 cells. There were no differences between MP2+COX2 and MP2−COX2 cells without AA (left panel).

