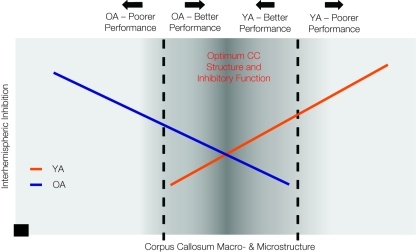
Figure 2.
This diagram provides a graphic representation of our hypothesis that performance on bimanual tasks falls along a continuum which demonstrates a shared optimal region of callosal microstructure and interhemispheric inhibition for young and older adults (darker gray central zone). Structure-physiological function-performance relationships differentially diverge from this range for the two age groups, with greater interhemispheric inhibition and reduced callosal structure associated with poorer performance in older adults and greater interhemispheric inhibition and greater callosal structure associated with poorer performance in young adults. The black square data point at x, y = 0 indicates that there is no capacity for interhemispheric inhibition in the complete absence of the corpus callosum.

