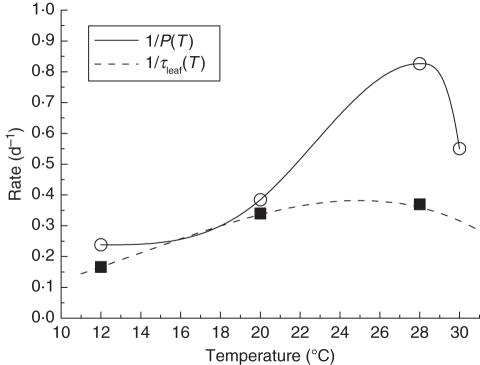
Fig. 5.
The rate of kiwifruit leaf appearance (solid line) and specific leaf growth rate (dashed line) as a function of temperature. The functions are fitted to data (squares, circles), collected by Seleznyova and Halligan (2006) and Morgan et al. (1985). From Cieslak et al. (2010), © 2010 IEEE.

