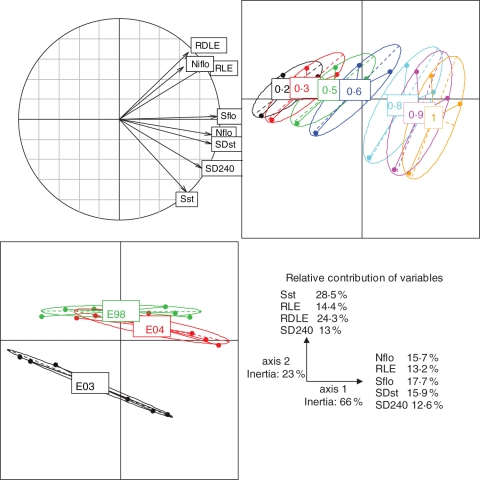
Fig. 3.
Correlation graph between variables according to a principal component analysis based on: the rate of leaf emergence (RLE), the number of leaves at flowering (Nflo), the rate of diseased leaf emergence (RDLE), the number of infected leaves at flowering (Niflo), and the disease leaf surface at shoot topping (SDst) and at the end of the epidemic (SD240). Individuals from the same vigour level (0·2–1) or from the same year (E98, E03 and E04) are joined by the same colour on the graph of principals.

