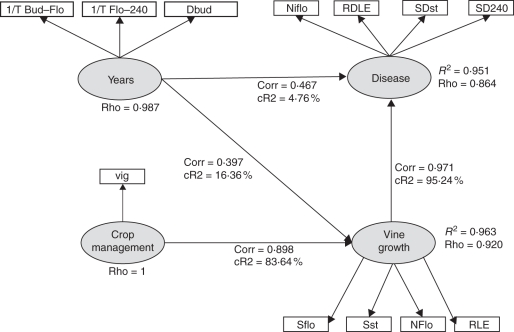
Fig. 4.
The PLS-path model describing the relationships between the endogenous latent variable ‘disease’ and the other latent exogenous variables ‘vine growth’, ‘year’ and ‘crop management’. Corr, the correlation coefficient between two latent variables; CR2, the relative contribution of exogenous latent variables to the endogenous one; R2, the regression coefficient between two latent variables; Rho, the Dillon–Goldstein's coefficient.

