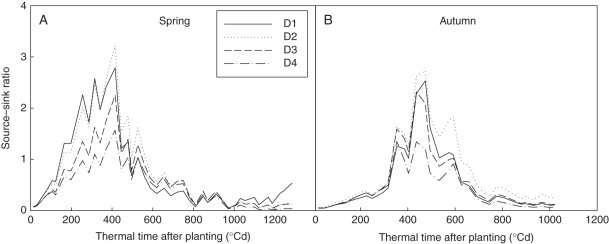
Fig. 7.
Evolution of the plant source–sink ratio (Q/D), computed as the ratio between plant biomass production and demand. It increased in the vegetative stage and then decreased when fruit-set began, in both spring (A) and autumn (B) experiments. D1, 1 plant m−2; D2, 3 plants m−2; D3, 6 plants m−2; D4, 11 plants m−2. Thermal time was expressed in growing degree-days, with a temperature base of 10 °C.

