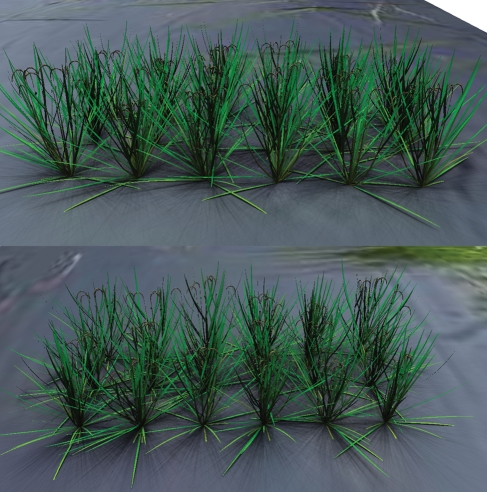
Fig. 6.
Simulated rice morphology: canopy at post-flowering stage showing the first 18 lines of the DH population derived from ‘IR64’/‘Azucena’ differing in plant height based on the data from QTL analysis. The scene was rendered with the GroIMP Twilight renderer, also showing light distribution within the canopy.

