Fig. 5.

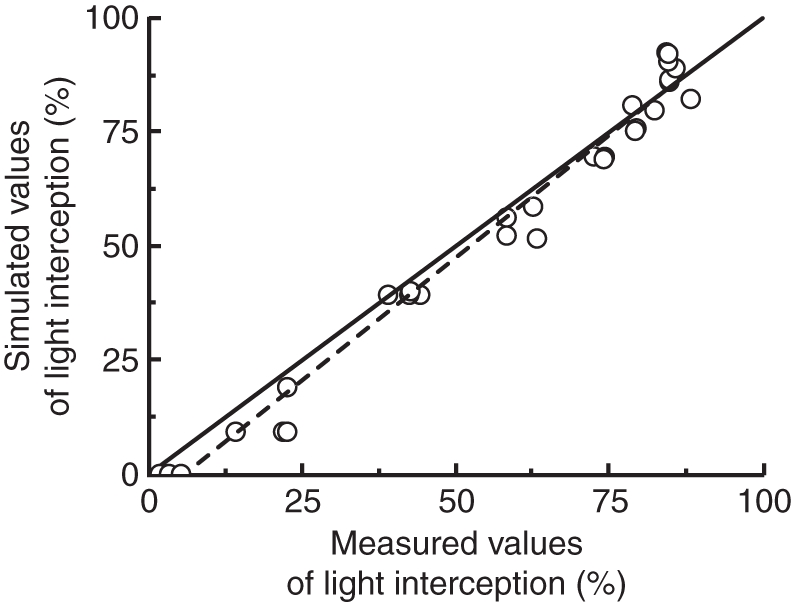
Measured vs. simulated values of light interception. Values are from 6 weeks of measurements in eight different canopy heights. The continuous line is 1 : 1.

Measured vs. simulated values of light interception. Values are from 6 weeks of measurements in eight different canopy heights. The continuous line is 1 : 1.