
Fig. 6.
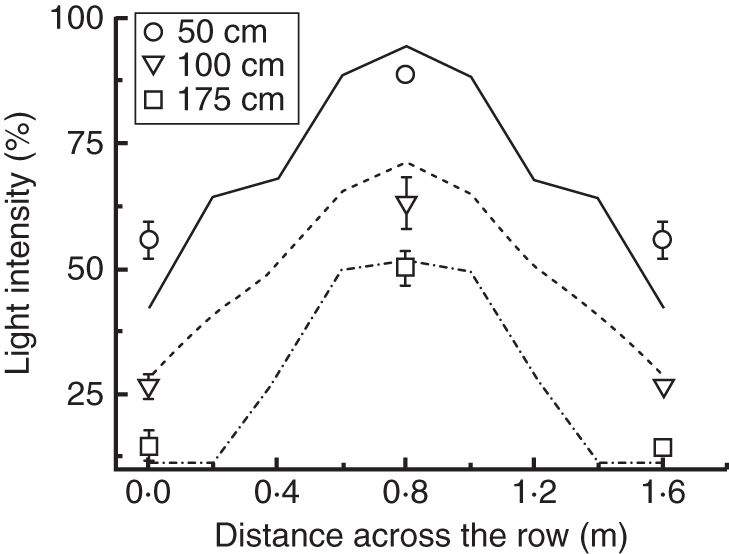
Measured and simulated horizontal light distribution in a tomato crop row. The light intensity is plotted against the plant row length at three different plant canopy heights (0·5, 1 or 1·75 m, as indicated). The lines represent simulated values while symbols represent measured values ± standard error of the mean. Plant rows are located at 20 cm and 140 cm while the middle of the path is located at 80 cm.