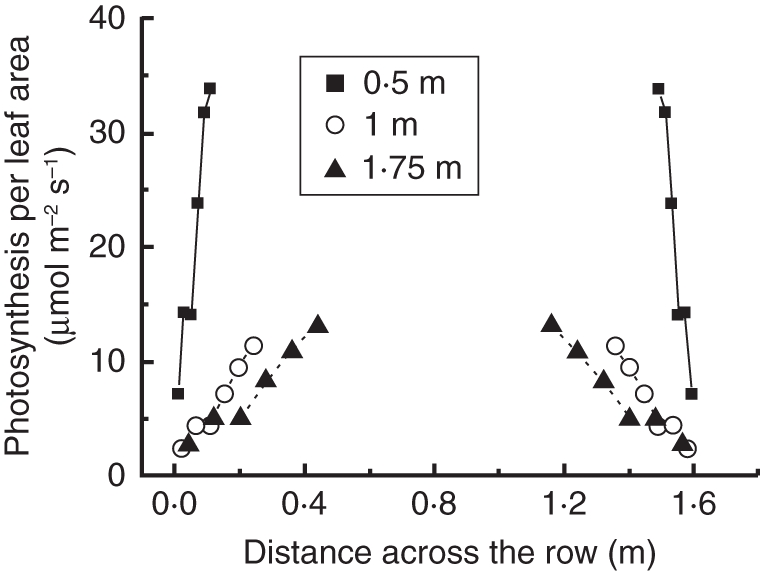
Fig. 8.

Horizontal distribution of photosynthesis in the crop path. In this graph only leaves positioned towards the path at three different canopy heights (0·5, 1 or 1·75 m, as indicated) are used. Each data point is the average of a pair of leaflets and includes the result from two or three leaves per plant from 20 plants depending on the leaves position. Simulation was performed under diffuse light conditions.
