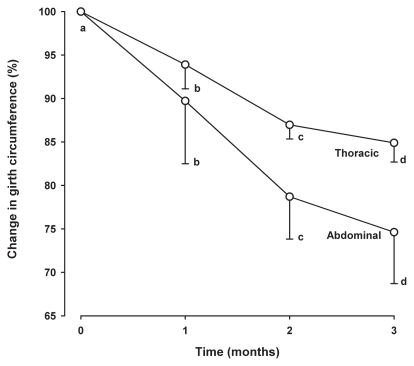
Figure 2.
Change in thoracic and abdominal girth measurements over the course of the program. The symbols represent the mean and bars represent standard deviation for percentage of initial girth circumference at each time point. Points with different letters are significantly different from one another. Significant reductions in both thoracic and abdominal girth measurement were noted at each revisit (Friedman test, P < 0.0001).

