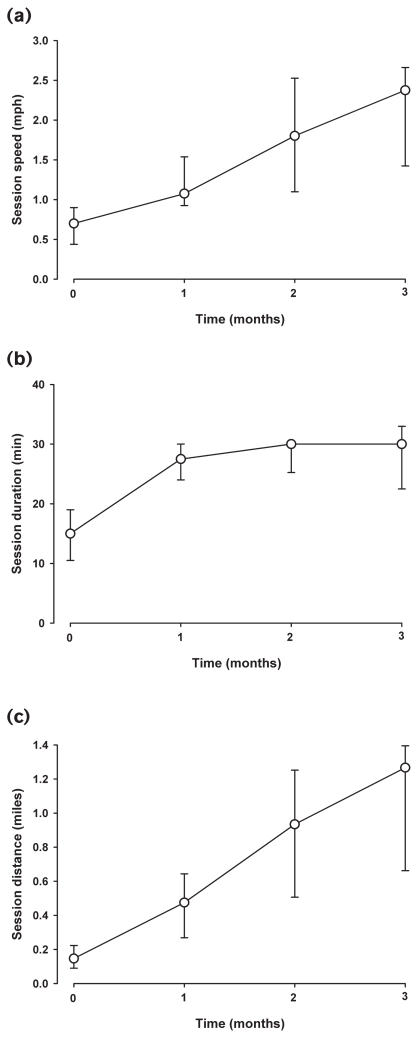
Figure 3.
Treadmill exercise levels during the program, represented as (a) session speed in miles per hour (mph), (b) session duration (in min), and (c) total distance travelled (in miles). The symbols represent the median value, whilst the upper and lower bars represent the interquartile range. A significant increase in speed, duration and total distance walked was noted during the course of the study (Cusick’s trend test, P = 0.0023, P = 0.0032, and P = 0.0010, respectively).

