Abstract
Purpose: In this study, newly formulated XR-RV3 GafChromic® film was calibrated with National Institute of Standards and Technology (NIST) traceability for measurement of patient skin dose during fluoroscopically guided interventional procedures.
Methods: The film was calibrated free-in-air to air kerma levels between 15 and 1100 cGy using four moderately filtered x-ray beam qualities (60, 80, 100, and 120 kVp). The calibration films were scanned with a commercial flatbed document scanner. Film reflective density-to-air kerma calibration curves were constructed for each beam quality, with both the orange and white sides facing the x-ray source. A method to correct for nonuniformity in scanner response (up to 25% depending on position) was developed to enable dose measurement with large films. The response of XR-RV3 film under patient backscattering conditions was examined using on-phantom film exposures and Monte Carlo simulations.
Results: The response of XR-RV3 film to a given air kerma depended on kVp and film orientation. For a 200 cGy air kerma exposure with the orange side of the film facing the source, the film response increased by 20% from 60 to 120 kVp. At 500 cGy, the increase was 12%. When 500 cGy exposures were performed with the white side facing the x-ray source, the film response increased by 4.0% (60 kVp) to 9.9% (120 kVp) compared to the orange-facing orientation. On-phantom film measurements and Monte Carlo simulations show that using a NIST-traceable free-in-air calibration curve to determine air kerma in the presence of backscatter results in an error from 2% up to 8% depending on beam quality. The combined uncertainty in the air kerma measurement from the calibration curves and scanner nonuniformity correction was ±7.1% (95% C.I.). The film showed notable stability. Calibrations of film and scanner separated by 1 yr differed by 1.0%.
Conclusions: XR-RV3 radiochromic film response to a given air kerma shows dependence on beam quality and film orientation. The presence of backscatter slightly modifies the x-ray energy spectrum; however, the increase in film response can be attributed primarily to the increase in total photon fluence at the sensitive layer. Film calibration curves created under free-in-air conditions may be used to measure dose from fluoroscopic quality x-ray beams, including patient backscatter with an error less than the uncertainty of the calibration in most cases.
Keywords: radiochromic film, skin dose, energy response, scanner nonuniformity, fluoroscopy
INTRODUCTION
Fluoroscopically guided interventional procedures have become vital tools in the treatment of disease. However, as the complexity of these procedures increases, so does procedure time, increasing skin dose and therefore the risk of serious skin injury.1, 2, 3, 4, 5, 6 For more than a decade, several methods have been developed to estimate or measure the skin dose patients receive from fluoroscopically guided procedures, in accordance with the U.S. Food and Drug Administration (FDA) recommendations.7 These methods include the use of thermoluminescent dosimeters (TLDs), radiochromic film, metal-oxide semiconductor field-effect transistors (MOSFETs), ionization chambers, and software-based dose calculators.8, 9, 10, 11, 12, 13, 14, 15, 16, 17, 18 MOSFETs and TLDs can be time-consuming to attach to a patient’s back and, unless there is a priori knowledge of the expected x-ray field locations, often produce an insufficient sampling density to capture the spatial features and peak dose from multiple overlapping x-ray exposures.9, 10 Radiochromic film offers high spatial resolution, large surface area (e.g., 14 in.×17 in.), and is easy to place under the patient, making it well-suited to measure skin dose during fluoroscopy. In addition, radiochromic film is self-developing and insensitive to visible light, making it easy to work with during analysis, and has been shown to have acceptable precision and accuracy for clinical measurements of skin dose.19
Film calibration and film-property measurements have been performed for several versions of fluoroscopic energy-range radiochromic film (e.g., GafChromic® MD-55, XR-R, and XR-RV2 films).19, 20, 21, 22, 23, 24, 25 This work examines the response of a newly formulated radiochromic film (GafChromic® XR-RV3) to four National Institute of Standards and Technology (NIST) traceable, moderately filtered x-ray beams in the energy range of 60–120 kVp, similar to beam qualities used for interventional procedures. The calibration of a commercial flatbed scanner for the digitization of radiochromic films is also reported. The energy dependence of the film response under backscattering conditions representative of typical fluoroscopic imaging was investigated using phantom measurements and Monte Carlo (MC) simulations.
METHODS AND MATERIALS
X-ray source
GafChromic XR-RV3 dosimetry radiochromic film (XR-RV3) from International Specialty Products (ISP) (Wayne, NJ) was calibrated using University of Wisconsin Accredited Dosimetry Calibration Laboratory (UW-ADCL) techniques and equipment and following AAPM Task Groups 55 (TG-55) and 61 (TG-61) guidelines.19, 26 The x-ray source was an AAPM-accredited NIST-traceable Advanced X-ray Technology, Inc. (Tucker, GA) system with a Gulmay CP320 constant potential generator and a Comet 320 tungsten anode tube. At 100 cm, this x-ray source produced a 10 cm×10 cm equivalent-square field, with an x-ray field flatness of less than 1% over the central 80% of the field. The air kerma rate at 100 cm from the x-ray source was determined using a NIST-calibrated Model A3 Exradin Shonka–Wyckoff spherical ion chamber (Standard Imaging®, Middleton, WI) with an uncertainty of ±1.0% (k=2) in its calibration coefficient. All exposures were performed with the center of the ion chamber or front surface of the film at 100 cm from the source and centered within the equivalent-square field.
The air kerma-film response relationship of the XR-RV3 film was determined at four x-ray beam qualities: UW60-M, UW80-M, UW100-M, and UW120-M (Table 1).27 The UW-ADCL uses these moderately filtered beams to calibrate ion chambers that are used clinically for fluoroscopic imaging system measurements. The first and second half-value layers (HVLs) of the x-ray beams were matched to x-ray beam standards at NIST.28 The Seelentag et al.29 GSF Report No. 560 beam codes that were used in the Monte Carlo simulations are also listed in Table 1.
Table 1.
Tungsten anode x-ray beam qualities for NIST, UW-ADCL, and Monte Carlo GSF beam codes, including the first HVL and homogeneity coefficients (HC).
| NIST x-ray beamsa | UW x-ray beamsb | GSF beamsc | |||||||
|---|---|---|---|---|---|---|---|---|---|
| Beam codes | First HVL (mm Al) | HC (%) | Beam codes | First HVL (mm Al) | HC (%) | Effective energy (keV) | Spectrum codes | First HVL (mm Al) | Effective energy (keV) |
| M60 | 1.64 | 63 | UW60-M | 1.68 | 66 | 26.9 | 49 | 1.54 | 26.0 |
| M80 | 2.98 | 68 | UW80-M | 2.96 | 68 | 33.5 | 60 | 2.76 | 32.5 |
| M100 | 5.00 | 74 | UW100-M | 4.98 | 72 | 42.1 | 71 | 5.02 | 42.2 |
| M120 | 6.72 | 77 | UW120-M | 6.96 | 78 | 49.9 | 80 | 6.31 | 47.5 |
Free-in-air film calibration
An entire sheet of film [14 in.×17 in. (35.6 cm×43.2 cm)] was divided into a 5×7 grid of 6 cm×6 cm sections and a 1×7 grid of 5 cm×6 cm sections. The film section size was selected to ensure that the calibration x-ray field was uniform to better than 1% over the film area. The film sections were numbered and marked so that they could be placed on the scanner bed to match their positions and orientations in the original sheet.19, 30 The XR-RV3 film was handled and cut in accordance to the guidelines recommended by TG-55.19 Before and after the exposures, the calibration films were stored in individual envelopes in a dark, environmentally controlled room. The temperature during the exposures, storage, and scanner measurements was between 20 and 22 °C.
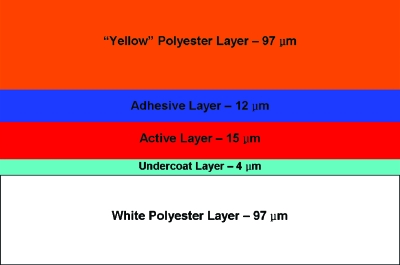
XR-RV3 film is a reflective-type film consisting of five layers, including an opaque white backing. The five layers are composed primarily of carbon, hydrogen, and oxygen. The active layer contains small quantities (less than 2% by mass) of lithium, nitrogen, and chlorine, while the opaque white polyester layer contains quantities of sulfur (less than 4% by mass) and barium (less than 16% by mass).31 The film values provided by the manufacturer were derived from calculations and not from direct measurement or analysis. The layer thickness, density, and composition values used in the Monte Carlo simulations, described in Sec. 2F, were the nominal values provided by ISP. The active layer thickness was reported to vary by less than 5% and the thicknesses of other layers were estimated to vary by less than ±20%.31 The elemental composition was reported to vary slightly between batches.31 The effective Z of all the layers of the XR-RV3 film combined is approximately 7.3.32
The large photoelectric cross-section of barium in the kilovoltage x-ray energy range used during fluoroscopy will result in a high yield of anisotropically ejected, long-range secondary electrons. Because of the high probability of photoelectrons generated in the barium-containing white layer of the film with ranges sufficient to reach the active layer, the orientation of the film in relation to the incident x-ray beam may affect the dose deposited in the active layer. ISP suggests that XR-R reflective-type films be used with the white side of the film facing the x-ray source.33 However, placing the white side toward the x-ray source results in a right∕left or top∕bottom reversal when viewing the exposed film after exposure. If the film is placed with the orange side facing the source, there is a direct correspondence between film darkening and location on the patient. To determine whether the film orientation affects film response, the same calibration experiments were performed with both the orange side and the white side of the film facing the x-ray source.
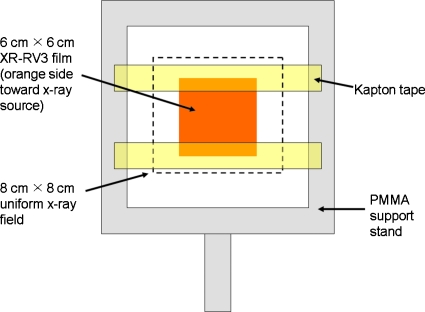
Nine air kerma values (15, 45, 100, 150, 200, 380, 570, 800, and 1100 cGy) and one unexposed background value were used to create the calibration curve for each of the four beam qualities. “Free-in-air” indicates that the calibration films were exposed to the primary x-ray beam with negligible x-ray scatter. This allowed for film calibration with NIST traceability. For each exposure, one 6 cm×6 cm film section was randomly selected from the 35 pieces cut from a single film. The film section was secured inside a poly(methylmethacrylate) (PMMA) support frame using two pieces of air-equivalent Kapton tape (Fig. 1). Exposures were made with two sets of films, one with the orange side facing the x-ray source and one with the white side facing the source. The interior border of the frame measured 12 cm×12 cm and did not lie within the primary radiation field. Based on the measured air kerma rate for the specific beam quality of interest, the constant potential x-ray system timer was set to deliver a known air kerma (free-in-air) at 100 cm.
Figure 1.
Free-in-air exposed XR-RV3 film calibration setup.
Several additional free-in-air exposures were performed to check the dose limits of XR-RV3 film beyond 1100 cGy and to assess the proper postexposure development time before measuring film response. One calibration film was irradiated free-in-air to 1500 cGy air kerma using the UW80-M beam quality. Four additional calibration films were irradiated free-in-air to 100, 200, 380, and 570 cGy air kerma, respectively, using the UW100-M beam quality. The response of each of these films was measured ten times over a 30 h period.
On-phantom film exposure
To measure entrance skin dose from fluoroscopy, the film will be placed against the back of a patient as he∕she lies on the procedure table. Under these conditions, the film is irradiated by both the primary x-ray beam and patient x-ray scatter. The scattering conditions will result in more photon fluence through the active layer of the film and therefore more absorbed dose and resulting film darkening. The mixture of primary and scattered radiation will also soften the overall energy spectrum compared to the primary x-ray beam used to calibrate the film. For the NIST-traceable, free-in-air film calibration to be applicable under clinical conditions, the energy-dependent response of the film must be similar under the primary-only and primary plus and scatter conditions. Therefore, in addition to free-in-air film calibration, the film response under patient-equivalent backscattering conditions was measured by exposing calibration films placed on the surface of a phantom. Monte Carlo simulations were performed to compare the energy spectra, photon fluence, and resulting air kerma between the free-in-air and on-phantom conditions.
The on-phantom irradiations used a 20 cm×20 cm×28 cm thick PMMA phantom and followed methods similar to Petoussi-Henss et al.34 and the Health Physics Society 2001 guidelines.35 The XR-RV3 film calibration sections were taped in the center of the phantom surface closest to the x-ray source. Again, two film setups were used, one with the orange side facing the x-ray source and one with the white side facing the source. The front surface of the phantom was positioned 100 cm from the source. The x-ray system timer was set to deliver a known air kerma at 100 cm as if the phantom was not present. The same four UW-ADCL beam qualities and the nine free-in-air air kerma levels were used for the on-phantom exposures.
Measurement of the film reflective density
The measured response (darkness) of radiochromic film depends on the wavelength used for readout, the densitometer (scanner), film orientation during scanning, the film batch, and the delay between irradiation and readout.19 As per ISP recommendations, as well as the successful results of other researchers, the calibration films were scanned with an Epson Expression 10000XL flatbed document scanner 24±4 h postexposure.19, 21, 22, 23, 24, 25, 33, 36 The postexposure time dependence of film darkening was also evaluated. The software package “EPSON SCAN” (Version 3.04A) was used to control the scan parameters, which included scanning in “Professional Mode,” reflective mode, with all imaging adjustment options turned off, and with a resolution of 72 dpi. As Martišíková et al.30 discovered for EBT-type radiochromic film, there is no measurable benefit of increasing the scanner resolution above 72 dpi (0.35 mm pixels). Resolution is limited more by light diffusion in the film and stray light in the scanner than the pixel size and higher-resolution scans often show considerably more noise.19, 30
Each calibration film section was placed orange-side down in the center of the scanner bed. To minimize potential film orientation issues that could be caused by the manner in which the active layer of the film was produced (i.e., a lattice arrangement), the calibration pieces were rotated so that the numbered orientation mark was consistently aligned.19, 37, 38 To simulate the scan of a full-sized patient film when using the smaller calibration films, a full-sized unexposed piece of XR-RV3 film was used as the background during the scans. All the films were scanned and images saved in 48 bit RGB uncompressed tagged image file format. To improve precision and also determine the scan-to-scan uncertainty, each calibration film was scanned successively five times. Scanning took approximately 2 h for all 37 film sections corresponding to one beam quality. Initial and final orange background (full-sized unexposed film) scans were performed to check for scanner variation and drift during the course of scanning.
The film images were analyzed in MATLAB® (The MathWorks®, Natick, MA), using custom-written code. The red, green, and blue color channels were isolated from each image, resulting in 16 bit images with pixel values ranging from 0 to 65 535. An average image was created from the five successive images to reduce image noise.38 To obtain an image value corresponding to a particular air kerma, a rectangular region of interest (ROI), approximately 3 cm×3 cm, was selected inside the film region of the image containing at least 9000 pixels. The pixel values inside the ROI were averaged and the standard deviation was calculated. After calculating the absolute average pixel value for each film density, the relative “reflective density” (RD) was calculated to be used as the values for the film calibration curves [RDrelative=log10(65 535∕Pixel Value)].
Scanner nonuniformity correction
Commercial fluorescent and LCD light scanners, such as the Epson 10000XL, have a tendency to produce nonuniform measurements for the same film darkness due to light-scattering effects.30, 37, 38, 39, 40, 41, 42, 43, 44, 45 The maximum response measurement tends to occur in the center of the scanner bed, decreasing toward the edges of the bed along the direction parallel to the length of the thin light source and perpendicular to the scanning direction of the light source. The degree of nonuniformity is also dependent on film darkness. Since a full-sized patient film may be exposed at any position on the film to a range of darkness levels, it is critical to evaluate and correct for these effects.
A spatial map of scanner response was generated by scanning the same calibration film at 42 different positions along the scanner bed to cover the entire scanning region.37, 38 The rotation of the film was consistent for each film position and the orange side of a full-sized unexposed film was used as the background for each scan. Then, a full-sized film image was simulated by stitching together the 42 film regions of the 42 scans using MATLAB. This procedure was repeated for each of the nine free-in-air exposed UW120-M calibration films (the darkest films for a given air kerma) and one unexposed film section. The result was a set of scanner response maps with a range of film darkness levels that would be encountered for any of the four beam qualities exposed up to 1100 cGy air kerma.
Monte Carlo simulations
The on-phantom film exposures, described in Sec. 2C, could not be matched to NIST-traceable air kerma values at the phantom entrance since the ionization chamber used to measure air kerma only had NIST calibration factors for free-in-air exposures (i.e., without backscattered x rays). Therefore, MC simulations were performed to determine the x-ray energy spectrum, photon fluence, energy fluence, and air kerma under free-in-air conditions and at the surface of a simulated PMMA phantom similar to the experimental setup. The ratio of the simulated on-phantom to free-in-air air kerma values was then used to adjust the measured free-in-air air kerma. Additional MC simulations were performed to investigate the dose deposited in each layer of the film for both orange-facing and white-facing exposures. Finally, to be clinically valuable, the film response must also be correlated with absorbed dose to skin under clinical conditions.26, 35 Air kerma-to-skin dose conversion factors and backscatter factors at various x-ray energies are available in the literature.26, 35, 46 However, supplementary MC simulations were performed to calculate free-in-air maximum absorbed dose to tissue (i.e., the “skin dose”) to air kerma conversion factors for x-ray beam qualities similar to the calibration beams.
MC simulations were implemented using a general Monte Carlo N-particle transport code, Version X (MCNPX™, Los Alamos National Laboratory, Los Alamos, NM). The x-ray source was modeled as an isotropic point source of polyenergetic photons truncated by a cone to produce a circular 10 cm×10 cm equivalent-square field at 100 cm from the source. The MC source model did not include heel effect since the experimental x-ray field was flat to less than 1% across the central 8 cm×8 cm of the field. Well-established tabulated GSF beam spectra for moderately filtered x-ray beams, which matched as closely as possible to the known properties of the physical x-ray beams (e.g., HVL), were selected for the input spectra (Table 1). The input spectra were applied at 100 cm without the inclusion of air scatter. The photon and electron cross-sections used in the simulations were from the mcplib04 and e103 libraries, respectively.47 The MC simulation source model, cross-section libraries, and GSF beam spectra were similar to those used by Davis et al.48 and Nunn et al.49 to calculate air kerma to dose conversion factors for TLDs irradiated with kilovoltage beams.
The free-in-air and on-phantom simulation geometries replicated the experimental free-in-air and on-phantom XR-RV3 film exposures. The film layers were modeled according to the geometry shown in Fig. 2 (note the difference between Fig. 2 and the configuration of GafChromic XR-RV2 given in Ref. 36). To calculate air kerma at the position of the film, the film model was replaced with a 6 cm×6 cm×15 μm slab of air (20 °C). Likewise, to calculate the maximum absorbed dose to tissue, the film model was replaced with a 6 cm×6 cm×15 μm slab of simulated International Commission on Radiation Units and Measurements (ICRU) four-component tissue. Material compositions and densities of the air, ICRU tissue, PMMA, and Kapton tape were obtained from NIST.50 The film layer compositions and densities for the specific batch of XR-RV3 film used in this study were manufacturing estimates provided by ISP.31
Figure 2.
GafChromic XR-RV3 film layers (Ref. 31). Note: The “yellow” polyester layer side of the film actually looks orange.
The MCNPX F6 energy deposition tally was used to calculate air kerma for the free-in-air and on-phantom geometries and also the maximum tissue dose for the free-in-air geometry. The photon energy cutoff was set to 1 keV. The F6 tally calculates the photon energy deposited locally per unit mass.51 That is, the tally estimates kerma. Kerma and collision kerma are equal for low-energy x rays interacting in homogeneous, low-Z materials, such as air and tissue. Under charged particle equilibrium (CPE), collision kerma is equal to the maximum dose. Therefore, calculating collision kerma using the F6 tally in a slab of tissue thick enough to provide sufficient volume-averaging for acceptable statistics yet thin enough to negligibly affect the x-ray spectra is equivalent to calculating the maximum skin dose in the presence of buildup in a thick slab of tissue. In the case of skin dose, the superficial layer of dead skin provides a buildup region that establishes CPE for x-ray energies less than 150 keV. The maximum dose is deposited in the sensitive skin layers just beyond the build-up region, typically considered the shallow dose at 70 μm.35
As stated previously, XR-RV3 film is composed of five layers, including a white polyester layer that contains barium. The large photoelectric cross-section of barium results in long-range secondary electrons that can deposit energy in adjacent layers. Therefore, the *F8 energy deposition tally was used to explicitly calculate the energy deposited in each layer of the film using both photon and electron transport.52 In order to closely examine dose deposition versus thickness in the film, each film layer was partitioned into 1 μm thick tally segments. Dividing the energy deposited by the mass of each segment yielded the absorbed dose per source photon. Film dose simulations were conducted for the free-in-air geometry for both the orange-facing and white-facing cases. The photon and electron energy cutoffs were set at 1 keV and the energy-deposit tally was used in conjunction with electron track sampling in each layer to produce acceptable statistical accuracy.
The photon fluence through air, tissue, and film was calculated with the F4 volume-averaged flux tally.51, 52 The photon-fluence energy distributions were binned at 1 keV intervals to determine the spectral shape of the incident photons. The fluence calculations were performed for all the geometries described above. All the simulations and calculations described in this section were carried out for each of the GSF beams listed in Table 1.
RESULTS
Color channel film response comparison
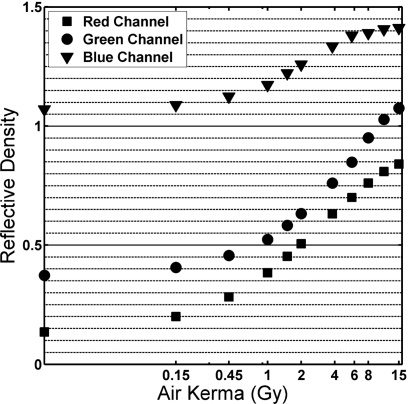
The 16 bit red, blue, and green channels of each calibration film image were analyzed separately for 11 free-in-air UW-80M calibration films. Figure 3 shows that the red channel provides the best differentiation in the low-kerma region (less than 100 cGy air kerma). This was consistent with previous radiochromic film investigations (reflective or transparent), as well as ISP recommendations.19, 21, 22, 23, 24, 25, 33, 36 Beyond 1000 cGy air kerma, the red-channel values increase more gradually than the green channel. ISP suggests analyzing the green channel for doses greater than 1000 cGy (potentially up to 50 Gy).36 In this investigation, the red channel was used to produce the film calibration curves.
Figure 3.
Reflective density versus air kerma for UW80-M beam quality. Red, green, and blue channels isolated and analyzed separately.
Film darkening over time
The film response versus postexposure time was evaluated at four different air kerma levels between 1 and 8 h at 1 h intervals, at 26 h, and then again at 30 h postexposure. The film continued to darken with time after exposure, changing most dramatically for the first 8 h postexposure and less noticeably thereafter. From 1 to 8 h postexposure, the measured film darkness increased by 1.6%, 1.5%, 1.1%, and 0.65% for the 100, 200, 380, and 570 cGy films, respectively. After an additional 18 h (26 h postexposure), the films were darker than the 1 h postexposure measurement by 2.0%, 1.8%, 1.3%, and 0.75%, respectively. At 30 h, the films were 2.2%, 2.1%, 1.3%, and 1.1% darker, respectively, than the 1 h postexposure measurement. The largest difference in measured film response between 8 and 30 h was for the 200 cGy film at 0.62%, which was less than the uncertainty in the average pixel value for the 200 cGy film (±0.8%). This was true for all four air kerma levels investigated.
Free-in-air film calibration
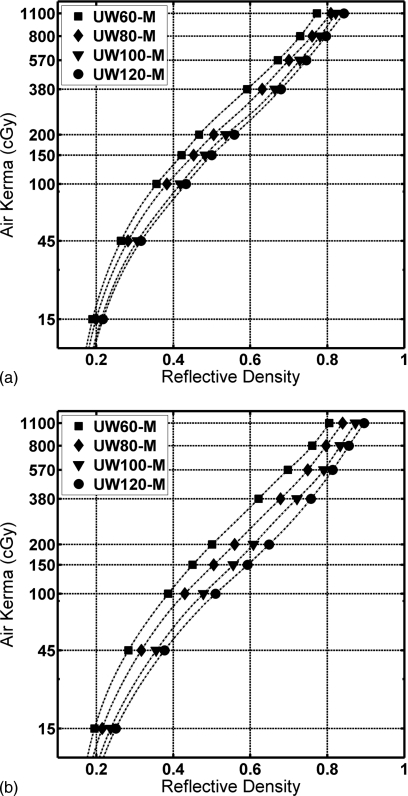
Figure 4 shows the average RD for XR-RV3 films exposed free-in-air with the orange side and the white side facing the x-ray source, respectively, versus air kerma measured free-in-air. Data points with spline-interpolated curves are shown for the UW60-M, UW80-M, UW100-M, and UW120-M beam qualities.
Figure 4.
Air kerma versus reflective density of the calibration films exposed free-in-air to the four beam qualities. (a) Orange side of the film facing the x-ray source. (b) White side of the film facing the x-ray source.
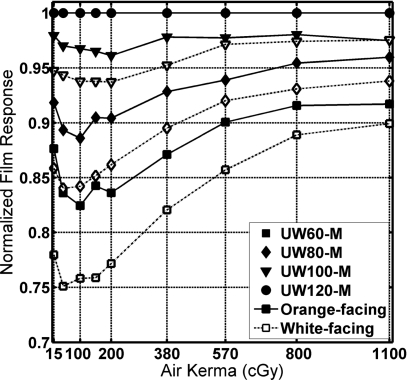
Figure 5 shows the measured film density divided by the film density at 120 kVp for each air kerma value. The energy dependence of XR-RV3 film decreased as the air kerma level increased. The white-facing exposures showed larger energy dependence than the orange-facing case. Per ISP product information for XR-RV2 radiochromic film, between 80 and 120 kVp fluoroscopic beam qualities, the difference in film darkening for a 500 cGy “exposure” was expected to be less than 8% (no dosimetry information was currently available specific to GafChromic XR-RV3 film).36 In this study, the difference between the UW80-M and UW120-M beam qualities at 500 cGy air kerma for orange-facing exposures was 7.0%. For the white-facing exposures, the difference was 9.4%.
Figure 5.
Energy dependence of XR-RV3 film versus air kerma. Normalized to UW120-M beam quality film response.
Preliminary work had been performed using GafChromic XR-RV2 film before ISP changed the formulation to XR-RV3. For those familiar with XR-RV2 film, these preliminary studies indicated that XR-RV2 film was more responsive than XR-RV3 film to air kerma values between 15 and 1100 cGy by an average of 8±4% for all four energies.
The calibration curves allow the air kerma during patient procedures to be estimated from the measured film density. The resulting air kerma map can be converted to a skin dose map using beam-specific maximum tissue dose-to-air kerma conversion factors. Our MC investigation of the maximum dose to ICRU four-component tissue per unit air kerma for the 60, 80, 100, and 120 kVp beams matched closely to values provide in TG-61.26 The ratios we calculated were 0.943, 0.953, 0.975, and 0.991, respectively.
Film response under backscattering conditions
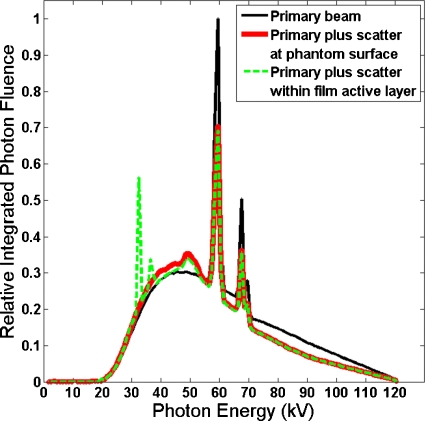
Figure 6 compares three MC-calculated spectra for the on-phantom geometry in the 120 kVp case: (a) Primary, (b) primary plus backscatter at phantom entrance, and (c) the spectrum incident upon the active layer of the film in the on-phantom geometry. The spectra are normalized to equal integrated photon fluence. The spectrum incident upon the active layer of the film is similar to the primary plus scatter spectrum, but also shows two barium fluorescence peaks. Average energy and photon-fluence and energy-fluence ratios between the primary plus scatter and primary spectra are listed in Table 2. The presence of backscatter lowered the average energy slightly. The largest average energy reduction was 5.8% for the GSF 80 (120 kVp) spectrum. For that same spectrum, photon fluence and air kerma at the face of the phantom increased 42% and 47%, respectively, compared to the free-in-air case. MC simulations indicated that the main effect of phantom backscatter on the x-ray spectrum at the film active layer was an increase in the total photon fluence.
Figure 6.
Comparison of the primary GSF 80 (120 kVp) spectrum to the primary plus scatter spectrum incident upon the simulated air at 20 °C and the active layer of the simulated film (the orange side facing the x-ray source) for the on-phantom geometry.
Table 2.
Monte Carlo simulated beam characteristics of GSF spectra incident upon air at 20 °C under free-in-air conditions and under PMMA phantom backscatter conditions.
| GSF spectrum codes | Average energy (keV) | Primary+backscatter versus primary | |||
|---|---|---|---|---|---|
| Primary (free-in-air) | Primary+backscatter (on-phantom) | Photon-fluence ratio | Energy-fluence ratio | Air kerma ratio | |
| 49 (UW-60M) | 34.4 | 33.9 | 1.308 | 1.288 | 1.307 |
| 60 (UW-80M) | 43.9 | 42.6 | 1.365 | 1.323 | 1.392 |
| 71 (UW-100M) | 54.0 | 51.4 | 1.407 | 1.339 | 1.463 |
| 80 (UW-120M) | 60.4 | 57.0 | 1.418 | 1.338 | 1.466 |
Air kerma increased more than fluence in the presence of backscatter because the decrease in average photon energy increases the average photon interaction cross-sections. Comparing the on-phantom to free-in-air air kerma ratios and the photon-fluence ratios shows that the decreased energy of the scattered photons increased the air kerma per photon by 2%, 4%, and 3% for the 80, 100, and 120 kVp beams, respectively, compared to the photon-fluence ratios. The 60 kVp beam showed a small decrease (0.09%) in air kerma compared to the primary spectrum alone, which is within the noise of the MC simulations.
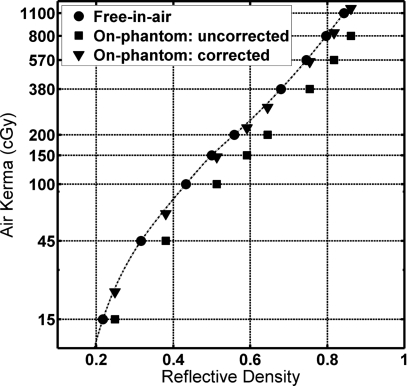
Figure 7 compares the free-in-air and on-phantom experimental results. The on-phantom uncorrected values are the RD for the on-phantom film versus the free-in-air air kerma value (measured without the phantom). The increased film darkening is due to backscattered photons. The increased air kerma responsible for the film darkening was estimated by the MC-generated on-phantom versus free-in-air air kerma ratio found in Table 2 and is plotted as the MC-corrected values.
Figure 7.
Air kerma versus reflective density of the calibration films exposed free-in-air, plotted together with uncorrected free-in-air air kerma versus on-phantom RD and corrected on-phantom air kerma versus on-phantom RD. (The orange side facing the x-ray source; UW120-M beam.)
Assuming the MC simulations produced accurate air kerma values, the results show that the free-in-air calibration curve slightly overpredicts the on-phantom air kerma. The average overpredictions between 45 and 1100 cGy were 2.0±1.7%, 3.9±1.5%, 4.3±1.9%, and 8.3±1.0% for the UW60-M, UW80-M, UW100-M, and UW120-M calibration beams, respectively, for orange-facing exposures. The same operation for the white-facing, on-phantom case yielded underpredictions in on-phantom air kerma when using the free-in-air calibration averaging 0.4±0.8%, 5.8±1.9%, 9.1±2.4%, and 13.4±1.1% for the four beams, respectively.
Orange-side versus white-side facing exposures
For all four beam qualities, the white-facing exposures resulted in higher (darker) film response compared to the orange-facing exposures. The differences increased with increasing beam quality. The differences were dependent on air kerma, peaking around 100 cGy and decreasing at higher air kerma levels. In the range from 45 to 1100 cGy, the average percent difference in film response to a given air kerma between the orange-white-side orientation was 6±1%, 9±2%, 11±3%, and 13±4% for the UW60-M, UW80-M, UW100-M, and UW120-M beam qualities, respectively.
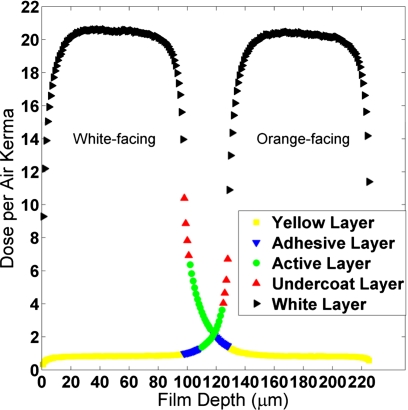
MC simulations were used to investigate the orientation-dependent film response. Figure 8 shows the MC-simulated dose per air kerma deposited in each 1 μm thick segment of the film layers for the GSF 80 (120 kVp) beam spectrum. The presence of barium in the white polyester layer results in high dose deposition in the white layer. The limited range and anisotropic angular distribution of photoelectrons results in a steep dose gradient at the edges of the white layer. Since the active layer of the film is separated from the white layer by only 4 μm (the undercoat layer), the dose to the active layer is sensitive to the shape of this gradient. When the white layer faces the x-ray source, the dose has a longer decay tail into adjacent film layers compared to when the orange side faces the source, resulting in higher average dose.
Figure 8.
Energy deposited in the film layers under free-in-air conditions, sampled in 1 μm thick segments (GSF 80 primary spectra). Primary x rays enter the film from left side of the plot (1 μm) and exit on the right side of the plot (225 μm).
The MC simulation showed the dose delivered to the active layer of the film, per unit air kerma, was 42%, 66%, 86%, and 91% greater in the white-facing case for the 60, 80, 100, and 120 kVp beams, respectively. Analysis of the experimental results also showed an increase in dose deposited in the active layer for white-facing films, although smaller in magnitude: 19%, 33%, 45%, and 59% greater for the four beam qualities studied. The difference between simulation and experiment may be due to both uncertainties in the film specifications provided by ISP and in the ability of MCNPX to track secondary electrons in thin adjacent layers.
Scanner nonuniformity correction
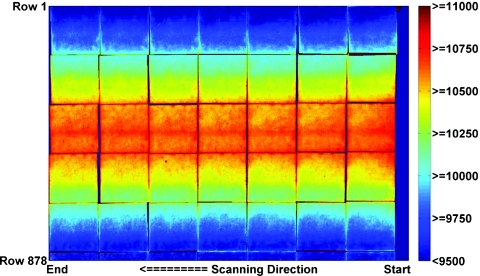
Figure 9 shows a contour plot of the measured film response of a full-sized stitched film image that was created using the same piece of film scanned at 42 different locations along the scanner bed. All scans occurred with unexposed orange background film in place.
Figure 9.
Contour plot of the pixel values of the uncorrected stitched image of the 6 cm×6 cm calibration film exposed free-in-air to 570 cGy air kerma, positioned and scanned separately at 42 different scanner bed locations on the Epson 10000XL scanner.
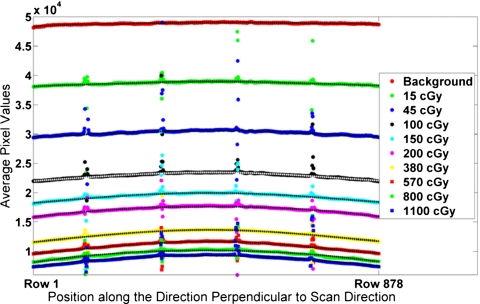
Spatial nonuniformity in scanner response was observed along the direction parallel to the thin light source (i.e., along the columns of the scanner image). Scanner response was fairly uniform along the direction of scanning (i.e., along the rows) for all film darkness levels (standard deviation range of ±0.3% to ±3% with an average value of ±0.9%). Therefore, a single profile perpendicular to the scanning direction was calculated from each stitched image and background image by averaging the pixels along each of the 878 rows. The outliers caused by the edges of the stitched film sections were excluded, resulting in the average of at least 800 pixels per row. Polynomial curves were fit to each profile. The data points of the average profiles (including outliers at the film gaps) for the ten measured film responses are shown in Fig. 10.
Figure 10.
Measured scanner profiles for each of the ten film darkness levels. The polynomial best-fit curves, excluding the outliers, are plotted as the dashed lines through the data points.
For the darkest films (exposed to greater than 570 cGy air kerma), the variation from the center of the scanner bed to the edges was greater than 25%. The scanner nonuniformity for the reflective scan was consistent with the experience of previous authors using transmission-type or reflective-type scans with commercial flatbed document scanners.30, 37, 38, 39, 40, 41, 42, 43, 44, 45
The scanner profiles show a monotonic decline in image value versus film darkness at fixed row position. Profiles at intermediate film darkening were obtained by linear interpolation of the measured data at a fixed row position. From these profiles, spatial nonuniformity correction factors were calculated for each combination of row position and raw image pixel value. To correct a specific raw pixel value, first the scanner profile with the same value at the position of measurement is obtained. Then, a multiplicative correction factor is calculated as the ratio of the value at the profile center to the value at the measurement position. For convenience, this was implemented as a two-dimensional lookup table, i.e., correction factor versus row position versus raw pixel value.
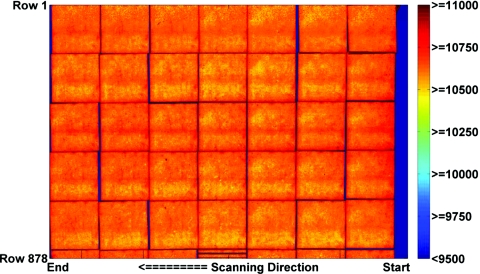
Figure 11 shows the result of applying this lookup table to the uncorrected stitched image shown in Fig. 9. After applying the scanner correction, for films exposed up to 570 cGy, the difference in image value for a point on the film averaged less than 0.6±0.3% when the film was placed at the edge of the scanner versus the center. For the 800 and 1100 cGy films, the corrected images were flat to within 1.5±0.5%.
Figure 11.
Contour plot of the pixel values of the corrected stitched image of the 6 cm×6 cm calibration film exposed free-in-air to 570 cGy air kerma, positioned and scanned separately at 42 different scanner bed locations on the Epson 10000XL scanner.
Uncertainty of calculated air kerma
Sources of uncertainty for the XR-RV3 calibration film exposure and measurement are shown in Table 3. The uncertainties are expressed as a percent with a confidence interval of 68% (k=1). The percent uncertainties add in quadrature and the final expanded uncertainty has a confidence interval of 95% (k=2).53
Table 3.
Example uncertainty analysis for measured film data from UW80-M data, expressed as percent.
| Uncertainty parameter | Type A | Type B | |
|---|---|---|---|
| Air kerma rate determination (ADCL) | 0.8 | ||
| X-ray field flatness | 0.3 | ||
| Film-to-film uniformity in one batch | 2.5 | ||
| Dose-rate film response | 1.5 | ||
| Film positioning | 0.3 | ||
| Shutter error | 0.1 | ||
| Pixel value uncertainty within ROI | 0.9 | ||
| Scan-to-scan uncertainty | 0.1 | ||
| Scanner drift | 0.1 | ||
| Quadratic sum | 0.9 | 3.1 | |
| A and B quadratic sum | 3.2 | ||
| Air kerma per film response % uncertainty (k=1) | 3.2 | ||
| Air kerma per film response expanded % uncertainty (k=2) | ±6.4 |
Using UW-ADCL techniques and equipment, the overall air kerma measurement uncertainty for low-energy x-ray beams was ±1.6% (k=2). This was mainly due to the uncertainty of the NIST calibration of the reference ion chamber (±0.5%, k=1) for the x-ray beams used in this study. The reported uncertainty in raw pixel value from the scanner (±0.9%, k=1) is based on the ROI standard deviation measured in the darkest film (1100 cGy air kerma). Smaller uncertainties were observed with lighter films. The uncertainty in the x-ray field flatness across the 6 cm×6 cm calibration films was better than 1%, with a 99% confidence interval. Therefore, the uncertainty of the field flatness was calculated to be ±0.3% (k=1). For XR-RV2 radiochromic film, ISP reports the film-to-film response variability within a batch as less than 5% and the dose-rate response (between 0.03 and 3 Gy∕min) of less than 3%.36 Assuming these variations are reported with 95% confidence, the uncertainties in these values are therefore ±2.5% and ±1.5%, respectively. Note that the batch-to-batch variation of XR-RV3 film reported by ISP is ±10%, so each new batch must be calibrated separately.31 The maximum difference between any two of five successive scans was 0.3%. Assuming a rectangular distribution, this leads to a scan-to-scan uncertainty of ±0.1% (k=1). Since this uncertainty value is less than the pixel value variation within the ROI, it was concluded that the light from the scanner did not cause the XR-RV3 film to darken measurably with each subsequent scan, unlike EBT-type radiochromic film.37 Scanner drift was calculated by comparing the initial and final background scans over the course of scanning the calibration films.
The final NIST-traceable calibration curve expanded uncertainty for calculating air kerma from the measured film darkness is equal to ±6.4% (k=2). Additional uncertainty in the calculated air kerma map must also include the uncertainty in the scanner correction lookup table. Following correction, the maximum percent deviation from flatness was 1.5% (observed for the darkest films). Using this value for the uncertainty due to scanner correction, the overall uncertainty of the film-measured air kerma map was estimated to be ±7.1% (k=2). Moreover, the same batch of XR-RV3 film and the same Epson 10000XL scanner were recalibrated 1 yr later. The average percent difference between RD values from the first calibration to the second calibration for all four beam qualities was 1.0±1.2% (k=1). The scanner correction continued to flatten the film response to within 1.5%.
Sources of uncertainty associated with the Monte Carlo investigations included uncertainties with the photon spectra, photon cross-sections, number of particles run, film thickness, film composition, and positioning. Only the uncertainties in the F6 kerma calculations are reported here since they are relevant to free-in-air and on-phantom film response analysis. The differences between the physical and simulated spectra are difficult to quantify since the low-energy photon tails of the M-series x-ray beams would tend to impact the energy deposited and the similarity of the low-energy tail region between the tabulated GSF beams used in the MC simulations and the UW-ADCL M-series beam qualities is still under investigation. However, Nunn et al.49 showed that for M-series beams above M50, an uncertainty of ±0.5% (k=1) was acceptable to take into account the differences in photon spectra for energies above 10 keV. Accuracy of atomic cross-section values were investigated by Cullen et al.54 and estimated to be accurate to ±2% for the x-ray energy range used in this study. Since ratios of MC-calculated kerma values were evaluated for materials composed of the same elements (i.e., free-in-air versus on-phantom air kerma), biased differences in cross-sectional accuracy will cancel. Sufficient particles were run for each MC simulation to reduce the statistical uncertainty for each calculation to less than 0.2%. The overall uncertainty in the ratio of on-phantom to free-in-air air kerma MC simulations, used to calculate the on-phantom entrance air kerma, and free-in-air maximum tissue dose per air kerma was estimated to be ±1.1% (k=2).
DISCUSSION
In 1994, the FDA issued warnings that serious skin injuries can occur to patients undergoing fluoroscopically guided interventional procedures.7 In 1995, the FDA followed with a specific call to document the location and skin dose estimate for any region receiving a dose exceeding 1 Gy.55 XR-RV3 GafChromic film can be used to meet this requirement. The benefits of using XR-RV3 film for skin dosimetric studies are high spatial resolution, large area to capture multiple entrance fields during interventional procedures, and ease of use compared to other types of dosimeters such as TLDs and diode-type detectors. The methods to calibrate the XR-RV3 film and Epson 10000XL scanner required several hours of scanning and analysis. A drawback of dosimetric film analysis is that it is not real-time so it cannot be used to prevent skin injury to a patient. However, the data can be used to inform proactive follow-up patient care and as a training tool for physicians. It can also be used to validate the accuracy of real-time methodologies.
While film calibration is performed free-in-air, a major component of film darkening for films exposed on-patient is due to backscattered photons. MC simulations indicated that while roughly 35% of photons in the mixed primary and scatter x-ray field are scattered photons, the spectra are similar to the original primary spectrum. Using the free-in-air calibration to measure on-patient air kerma results in an overprediction between 2% (60 kVp) and 8% (120 kVp) for the orange-facing case. For the white-facing case, on-patient air kerma is underpredicted by 0.4% (60 kVp) to 13% (120 kVp). Accounting for this dependence allows use of the NIST-traceable free-in-air calibration curves to estimate air kerma during patient procedures. The air kerma map can then be converted to a skin dose map using beam-specific maximum tissue dose-to-air kerma conversion factors.
The response of XR-RV3 film was dependent on the orientation of the film to the x-ray source. The film is more sensitive when the white side faces the x-ray source, whereas the orange-facing orientation provides better discrimination at high levels of air kerma. The orange-facing orientation also has a lower energy dependence. MC simulations indicated the source of the asymmetric response. Dose to the active layer of the film is primarily due to a steep dose gradient that arises from the barium-containing white layer. The shape of this dose gradient is dependent on the direction of the incident x-ray photons. If the orientation between the calibration and the clinical exposures are reversed, the error in the measured air kerma value from a RD measurement can be up to 60%, depending on the beam quality and air kerma.
The greatest challenge in using XR-RV3 film in the clinic is the energy dependence exhibited by the film. For example, an orange-facing film exposed to 500 cGy at 100 kVp will exhibit a RD of 0.71. This same RD represents an air kerma of 450 cGy at 120 kVp (10% less) or 600 cGy at 80 kVp (20% greater). The difference is even greater in the white-facing case. A RD of 0.77 represents an air kerma of 500 cGy at 100 kVp, 420 cGy at 120 kVp (16% less), or 670 cGy at 80 kVp (34% greater). As a result, it is challenging to calculate skin dose at a film point which receives exposure from multiple beams at varying kVps and durations, as is often the case for interventional procedures. If, as a practical matter, a single calibration energy is chosen to convert film darkening to a map of skin dose, the results reported here can provide an estimate of the error associated with energy dependence. It is noteworthy that these errors are less when the orange side of the film faces the x-ray source.
Stability of the calibration process is critical if radiochromic film is to be used clinically. Investigation showed that by scanning the film 24±4 h postexposure, variation in film darkening over the 8 h window is less than the uncertainty in the scanning measurement. The flatbed scanner exhibited both a spatial and signal (i.e., film darkness) dependent response. Without a nonuniformity correction, a measured film response may be in error by up to 25% for the darkest film regions measured near the edges of the scanner bed. The uniformity correction flattened the response to less than 1.5%. Repeated 1 yr later, the combination film calibration and scanner response changed by only 1%.
CONCLUSIONS
XR-RV3 film was calibrated with NIST traceability using UW-ADCL methods and equipment. Air kerma versus XR-RV3 reflective density calibration curves were created for four moderately filtered x-ray beam qualities expected during fluoroscopically guided interventional procedures. Calibration curves showed a strong dependence on film orientation (white side versus orange side facing the x-ray source) and kVp and small dependence on patient-equivalent backscattering. A scanner measurement nonuniformity correction was also developed for the Epson 10000XL scanner. The overall uncertainty of the air kerma map calculated from the calibration curves and corrected for scanner measurement nonuniformity was ±7.1% (k=2). Repeat calibration studies one year later showed a difference of 1%.
ACKNOWLEDGMENTS
Financial support for this work was provided by NIH Grant No. R01 HL084022. The authors would like to thank Dr. Stephen Davis, formerly at the UW Medical Radiation Research Center, currently at McGill University for his help with the Monte Carlo simulations and uncertainty estimations; John Micka of the UW Medical Radiation Research Center for access to the necessary equipment, as well as training; Dr. David Lewis of ISP for information regarding the XR-RV3 radiochromic film; and Dr. Michael Kissick for the use of his Epson 10000XL scanner, as well as guidance with the necessary scanner correction.
References
- Shope T., “Radiation-induced skin injuries from fluoroscopy,” Radiographics 16, 1195–1199 (1996). [DOI] [PubMed] [Google Scholar]
- McFadden S. L., Mooney R. B., and Shepherd P. H., “X-ray dose and associated risks from radiofrequency catheter ablation procedures,” Br. J. Radiol. 75, 253–265 (2002). [DOI] [PubMed] [Google Scholar]
- Koenig T. R., Wolff D., Mettler F. A., and Wagner L. K., “Skin injuries from fluoroscopically guided procedures: Part 1, Characteristics of radiation injury,” AJR, Am. J. Roentgenol. 177, 3–11 (2001). [DOI] [PubMed] [Google Scholar]
- Koenig T. R., Mettler F. A., and Wagner L. K., “Skin injuries from fluoroscopically guided procedures: Part 2, Review of 73 cases and recommendations for minimizing dose delivered to patient,” AJR, Am. J. Roentgenol. 177, 13–20 (2001). [DOI] [PubMed] [Google Scholar]
- Vlietstra R. E. and Wagner L. K., “X-ray burns—Painful, protracted and preventable,” Clin. Cardiol. 31, 145–147 (2008). 10.1002/clc.20204 [DOI] [PMC free article] [PubMed] [Google Scholar]
- Dendy P. P., “Radiation risks in interventional radiology,” Br. J. Radiol. 81, 1–7 (2008). 10.1259/bjr/15413265 [DOI] [PubMed] [Google Scholar]
- Food and Drug Administration, “Avoidance of serious x-ray induced skin injuries to patients during fluoroscopically guided procedures” (FDA Center for Devices and Radiological Health, 5600 Fishers Lane, Rockville, MD 20857, 9 September 1994).
- Balter S., Schueler B. A., Miller D. L., Cole P. E., Lu H. T., Berenstein A., Albert R., Georgia J. D., Noonan P. T., Russell E. J., Malisch T. W., Vogelzang R. L., Geisinger M., Cardella J. F., St. George J., G. L.MillerIII, and Anderson J.. “Radiation doses in interventional radiology procedures: The RAD-IR study; Part III: Dosimetric performance of the interventional fluoroscopy units,” J. Vasc. Interv. Radiol. 15, 919–926 (2004). [DOI] [PubMed] [Google Scholar]
- Balter S., “Methods of measuring fluoroscopic skin dose,” Pediatr. Radiol. 36, 136–140 (2006). 10.1007/s00247-006-0193-3 [DOI] [PMC free article] [PubMed] [Google Scholar]
- Bower M. W. and Hintenlang D. E., “The characterization of a commercial MOSFET dosimeter system for use in diagnostic radiology,” Health Phys. 75, 197–204 (1998). 10.1097/00004032-199808000-00013 [DOI] [PubMed] [Google Scholar]
- Chida K., Kagaya Y., Saito H., Takai Y., Takahashi S., Yamada S., Kohzuki M., and Zuguchi M., “Total entrance skin dose: An effective indicator of maximum radiation dose to the skin during percutaneous coronary intervention,” AJR, Am. J. Roentgenol. 189, W224–W227 (2007). 10.2214/AJR.07.2422 [DOI] [PubMed] [Google Scholar]
- Chu R. Y. L., Schechter E., and Chu N., “Dose indices of radiation to skin in fluoroscopically guided invasive cardiology procedures,” Health Phys. 93, S124–S127 (2007). 10.1097/01.HP.0000259851.86208.0d [DOI] [PubMed] [Google Scholar]
- den Boer A., de Feijter P. J., Serruys P. W., and Roelandt J. R. T. C., “Real-time quantification and display of skin radiation during coronary angiography and intervention,” Circulation 104, 1779–1784 (2001). 10.1161/hc4001.097057 [DOI] [PubMed] [Google Scholar]
- Devic S., Seuntjens J., Abdel-Rahman W., Evans M., Olivares M., Podgorsak E. B., Vuong T., and Soares C. G., “Accurate skin dose measurements using radiochromic film in clinical applications,” Med. Phys. 33, 1116–1124 (2006). 10.1118/1.2179169 [DOI] [PubMed] [Google Scholar]
- Fletcher D. W., Miller D. L., Balter S., and Taylor M. A., “Comparison of four techniques to estimate radiation dose to skin during angiographic and interventional radiology procedures,” J. Vasc. Interv. Radiol. 13, 391–397 (2002). 10.1016/S1051-0443(07)61742-4 [DOI] [PubMed] [Google Scholar]
- Giles E. R. and Murphy P. H., “Measuring skin dose with radiochromic dosimetry film in the cardiac catheterization laboratory,” Health Phys. 82, 875–880 (2002). 10.1097/00004032-200206000-00017 [DOI] [PubMed] [Google Scholar]
- Meyer P., Regal R., Jung M., Siffert P., Mertz L., and Constantinesco A., “Feasibility of a semiconductor dosimeter to monitor skin dose in interventional radiology,” Med. Phys. 28, 2002–2006 (2001). 10.1118/1.1405846 [DOI] [PubMed] [Google Scholar]
- Vano E., Gonzalez L., Guibelalde E., Aviles P., Fernandez J. M., Prieto C., and Galvan C., “Evaluation of risk of deterministic effects in fluoroscopically guided procedures,” Radiat. Prot. Dosim. 117, 190–194 (2005). 10.1093/rpd/nci714 [DOI] [PubMed] [Google Scholar]
- Niroomand-Rad A., Blackwell C. R., Coursey B. M., Gall K. P., Galvin J. M., McLaughlin W. L., Meigooni A. S., Nath R., Rodgers J. E., and Soares C. G., “Radiochromic film dosimetry: Recommendations of AAPM Radiation Therapy Committee Task Group 55,” Med. Phys. 25, 2093–2115 (1998). 10.1118/1.598407 [DOI] [PubMed] [Google Scholar]
- Butson M. J., Cheung T., and Yu P. K. N., “XR type-R radiochromic film x-ray energy response,” Phys. Med. Biol. 50, N195–N199 (2005). 10.1088/0031-9155/50/15/N04 [DOI] [PubMed] [Google Scholar]
- delle Canne S., Carosi A., Bufacchi A., Malatesta T., Capparella R., Fragomeni R., Adorante N., Bianchi S., and Begnozzi L.. “Use of GafChromic XR type R films for skin-dose measurements in interventional radiology: Validation of dosimetric procedure on a sample of patients undergone interventional cardiology,” Phys. Medica 22, 105–110 (2006). 10.1016/S1120-1797(06)80004-9 [DOI] [PubMed] [Google Scholar]
- Dini S. A., Koona R. A., Ashburn J. R., and Meigooni A. S., “Dosimetric evaluation of GafChromic® XR Type T and XR type R films,” J. Appl. Clin. Med. Phys. 6, 114–134 (2005). 10.1120/jacmp.2023.25329 [DOI] [PMC free article] [PubMed] [Google Scholar]
- Rampado O., Garelli E., Deagostini S., and Ropolo R., “Dose area product evaluations with GafChromic® XR-R films and a flat-bed scanner,” Phys. Med. Biol. 51, N403–N409 (2006). 10.1088/0031-9155/51/23/N01 [DOI] [PubMed] [Google Scholar]
- Thomas G., Chu R. Y. L., and Rabe F., “A study of GafChromic XR type R film response with reflective-type densitometers and economical flatbed scanners,” J. Appl. Clin. Med. Phys. 4, 307–314 (2003). 10.1120/1.1621373 [DOI] [PMC free article] [PubMed] [Google Scholar]
- Blair A. and Meyer J., “Characteristics of GafChromic® XR-RV2 radiochromic film,” Med. Phys. 36, 3050–3058 (2009). 10.1118/1.3147141 [DOI] [PubMed] [Google Scholar]
- Ma C. -M., Coffey C. W., DeWerd L. A., Liu C., Nath R., Seltzerf S. M., and Seuntjens J. P., “AAPM protocol for 40-300 kV x-ray beam dosimetry in radiotherapy and radiobiology,” Med. Phys. 28, 868–893 (2001). 10.1118/1.1374247 [DOI] [PubMed] [Google Scholar]
- UW Medical Radiation Research Center, “Beam qualities,” http://uwmrrc.wisc.edu/index.php?option=com_content&task=view&id=64&Itemid=84 (accessed January 2011).
- NIST, “Ionizing radiation measurements,” http://ts.nist.gov/MeasurementServices/Calibrations/x-gamma-ray.cfm (accessed January 2011).
- Seelentag W. W., Panzer W., Drexler G., Platz L., and Santner F., “A catalogue of spectra used for the calibration of dosemeters,” GSF Report No. 560 (Gesellschaft für Strahlen und Umweltforschung, München, 1979).
- Martišíková M., Ackermann B., and Jäkel O., “Analysis of uncertainties in GafChromic® EBT film dosimetry of photon beams,” Phys. Med. Biol. 53, 7013–7027 (2008). 10.1088/0031-9155/53/24/001 [DOI] [PubMed] [Google Scholar]
- ISP, “Composition and structure of XR-RV3,” (private communication with Dr. David Lewis, International Specialty Products, Wayne, NJ, October 2009).
- Murty R. C., “Effective atomic numbers of heterogeneous materials,” Nature (London) 207, 398–399 (1965). 10.1038/207398a0 [DOI] [Google Scholar]
- ISP, “Calibration method for GafChromic XR-R,” http://online1.ispcorp.com/_layouts/Gafchromic/content/products/xrr/pdf/ProdCal.pdf (accessed January 2011).
- Petoussi-Henss N., Zankl M., Drexler G., Panzer W., and Regulla D., “Calculation of backscatter factors for diagnostic radiology using Monte Carlo methods,” Phys. Med. Biol. 43, 2237–2250 (1998). 10.1088/0031-9155/43/8/017 [DOI] [PubMed] [Google Scholar]
- Health Physics Society, “Personal dosimetry performance—Criteria for testing,” American National Standards ANSI/HPS N13.11–2001 (Health Physics Society, 1313 Dolley Madison Blvd., Suite 402, McLean, VA 22101, 2001).
- ISP, “GafChromic® XR-RV2 radiochromic dosimetry films for low energy photons: Configuration and specifications,” http://online1.ispcorp.com/_layouts/Gafchromic/content/products/xrr/pdf/hilight.pdf (accessed January 2011).
- Paelinck L., DeNeve W., and DeWagter C., “Precautions and strategies in using a commercial flatbed scanner for radiochromic film dosimetry,” Phys. Med. Biol. 52, 231–242 (2007). 10.1088/0031-9155/52/1/015 [DOI] [PubMed] [Google Scholar]
- Saur S. and Frengen J., “GafChromic EBT film dosimetry with flatbed CCD scanner: A novel background correction method and full dose uncertainty analysis,” Med. Phys. 35, 3094–3101 (2008). 10.1118/1.2938522 [DOI] [PubMed] [Google Scholar]
- Alva H., Mercado-Uribe H., Rodríguez-Villafuerte M., and Brandan M. E., “The use of a reflective scanner to study radiochromic film response,” Phys. Med. Biol. 47, 2925–2933 (2002). 10.1088/0031-9155/47/16/308 [DOI] [PubMed] [Google Scholar]
- Devic S., Seuntjens J., Sham E., Podgorsak E. B., Schmidtlein C. R., Kirov A. S., and Soares C. G., “Precise radiochromic film dosimetry using a flat-bed document scanner,” Med. Phys. 32, 2245–2253 (2005). 10.1118/1.1929253 [DOI] [PubMed] [Google Scholar]
- Fiandra C., Ricardi U., Ragona R., Anglesio S., Giglioli F. R., Calamia E., and Lucio F., “Clinical use of EBT model GafChromic™ film in radiotherapy,” Med. Phys. 33, 4314–4319 (2006). 10.1118/1.2362876 [DOI] [PubMed] [Google Scholar]
- ISP, “Effects of light scattering by films on the performance of CCD scanners,” http://online1.ispcorp.com/_layouts/Gafchromic/content/products/ebt/pdfs/EffectLight.pdf (accessed January 2011).
- Kalef-Ezra J. and Karava K., “Radiochromic film dosimetry: Reflection vs transmission scanning,” Med. Phys. 35, 2308–2311 (2008). 10.1118/1.2919092 [DOI] [PubMed] [Google Scholar]
- Lynch B. D., Kozelka J., Ranade M. K., Li J. G., Simon W. E., and Dempsey J. F., “Important considerations for radiochromic film dosimetry with flatbed CCD scanners and EBT GafChromic® film,” Med. Phys. 33, 4551–4556 (2006). 10.1118/1.2370505 [DOI] [PubMed] [Google Scholar]
- Menegotti L., Delana A., and Martignano A., “Radiochromic film dosimetry with flatbed scanners: A fast and accurate method for dose calibration and uniformity correction with single film exposure,” Med. Phys. 35, 3078–3085 (2008). 10.1118/1.2936334 [DOI] [PubMed] [Google Scholar]
- Ma C. -M. and Seuntjens J. P., “Mass-energy absorption coefficients and backscatter factor ratios for kilovoltage x-ray beams,” Phys. Med. Biol. 44, 131–143 (1999). 10.1088/0031-9155/44/1/011 [DOI] [PubMed] [Google Scholar]
- White M. C., “Photoatomic data library MCPLIB04: A new photoatomic library based on data from ENDF/B-VI Release 8,” Memorandum No. LAUR-03-1019 (Los Alamos National Laboratory, 2003).
- Davis S. D., Ross C. K., Mobit P. N., van der Zwan L., Chase W. J., and Shortt K. R., “The response of LiF thermoluminescence dosemeters to photon beams in the energy range from 30 kV x rays to 60Co gamma rays,” Radiat. Prot. Dosim. 106, 33–43 (2003). [DOI] [PubMed] [Google Scholar]
- Nunn A. A., Davis S. D., Micka J. A., and DeWerd L. A., “LiF:Mg, Ti TLD response as a function of photon energy for moderately filtered x-ray spectra in the range of 20–250 kVp relative to 60Co ,” Med. Phys. 35, 1859–1869 (2008). 10.1118/1.2898137 [DOI] [PubMed] [Google Scholar]
- Hubbell J. H. and Seltzer S. M., “Tables of x-ray mass attenuation coefficients and mass energy-absorption coefficients,” version 1.4 (2004) (online). Available at http://physics.nist.gov/xaamdi, National Institute of Standards and Technology, Gaithersburg, MD (January 2011); Originally published as NISTIR Report No. 5632 (National Institute of Standards and Technology, Gaithersburg, MD, 1995).
- X-5 Monte Carlo Team, “MCNP—A general Monte Carlo N-particle transport code, version 5: Overview and theory” (Los Alamos National Laboratory, USA, 2003), Vol. 1.
- X-5 Monte Carlo Team, “MCNP—A general Monte Carlo N-particle transport code, version 5: User’s guide” (Los Alamos National Laboratory, USA, 2003), Vol. 2.
- Taylor B. and Kuyatt C., “Guidelines for evaluating and expressing uncertainty for NIST measurement results,” NIST Technical Note 1297 (1994).
- Cullen D. E., Hubbell J. H., and Kissel L., “EPDL97: The evaluated photon data library, version 97,” Memorandum UCRL-50400, Vol. 6, Rev. 5 (Lawrence Livermore National Laboratory, 1997).
- Food and Drug Administration, “Recording information in the patient’s medical record that identifies the potential for serious x-ray-induced skin injuries” (FDA Center for Devices and Radiological Health, 5600 Fishers Lane, Rockville, MD 20857, 1995).


