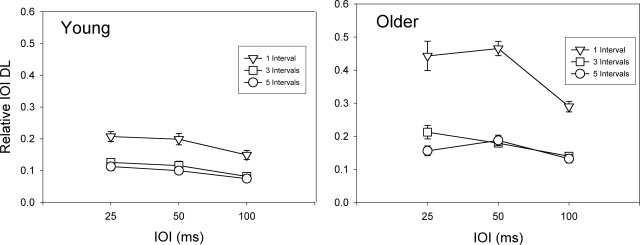
Figure 4.
Mean relative IOI DL as a function of the reference IOI for each number of sequence intervals. The leftmost figure panel shows results for the younger listeners, and the rightmost panel shows results for the older listeners, with data collapsed across hearing-loss groups. Error bars reflect 1 SE of the mean.

