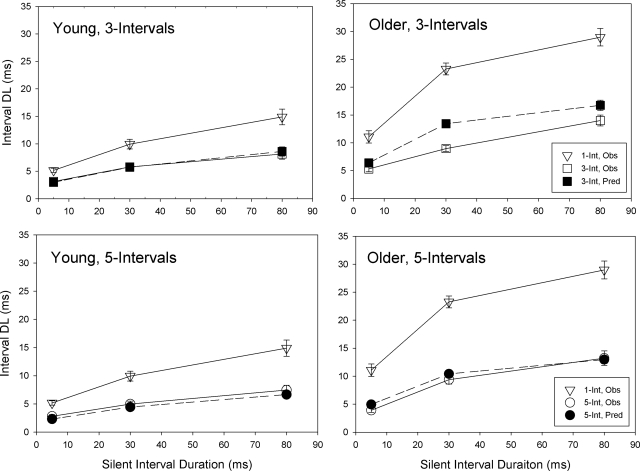
Figure 5.
Mean silent-interval DLs and a function of the sequence silent interval duration for the young (leftmost panels) and older (rightmost panels) listeners. Figure panels at the top show DLs for the single- and three-interval sequences, while the bottom panels show DLs for the single- and five-interval sequences. In each figure panel, open symbols represent observed DLs, and closed symbols represent DLs predicted by the multiple-look hypothesis.

