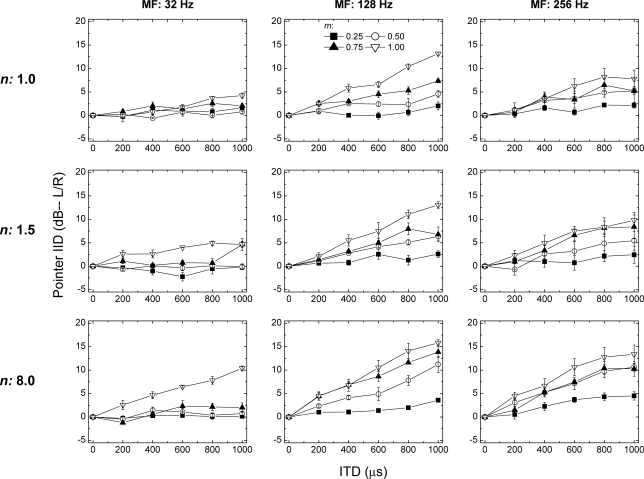
Figure 1.
The panels in the left-most, middle, and right-most columns display the data obtained when the frequency of modulation was 32, 128, or 256 Hz, respectively. The panels along the top, middle, and bottom rows display the data obtained when the exponent of the raised-sine was 1.0, 1.5, or 8.0, respectively. Each panel displays the IID of the pointer (in dB) required to match the intracranial position of the target as a function of the ongoing ITD (left ear leading) imposed on a 200-Hz-wide band of Gaussian noise centered at 500 Hz. Data points represent the mean values computed across the three listeners. The error bars represent ±1 standard error of the mean. The parameter within each plot is the depth of modulation (m).

