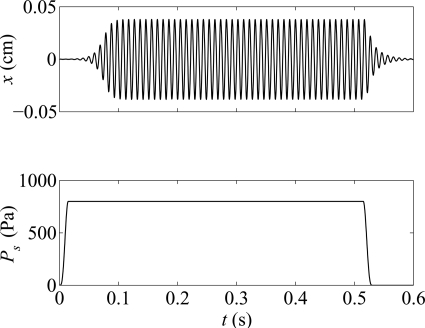
Figure 3.
Simulation of the vocal fold oscillation, for the parameter configuration in Table TABLE I.. Upper panel: Vocal fold displacement x(t). Lower panel: Subglottal pressure Ps(t), with t1 = τ, t2 = 15 ms, t3 = 515 ms, t4 = 530 ms, and T = 1000 ms. For clarity of the plots, only the time interval [0, 600] ms is shown.

