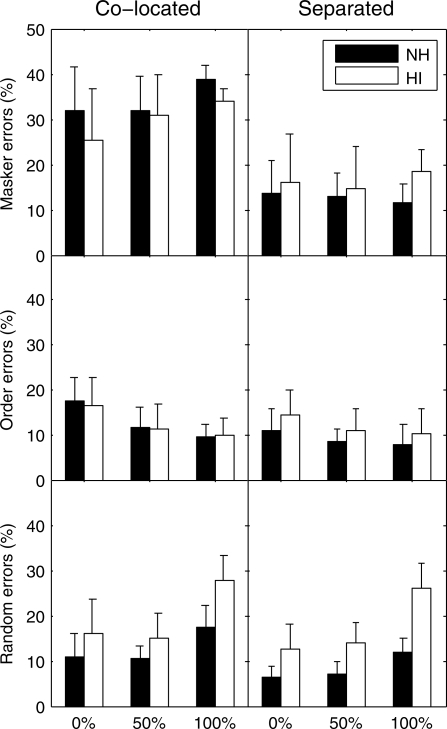
Figure 7.
Error rates for the NH and HI groups. The left and right columns show data for the co-located and separated configurations, and the three rows show masker errors, order errors, and random errors. The three clusters of bars in each panel show the three overlap conditions. Bars show the mean error rates in percent of total trials, such that the different error rates add up to the total percentage of incorrect trials. The error bars show ±1 standard deviation of the mean.

