FIGURE 3:
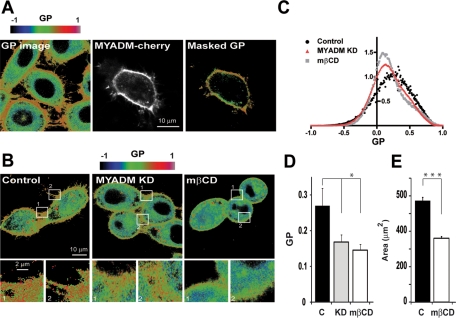
MYADM KD reduces membrane condensation. (A) HeLa cells transiently expressing MYADM-cherry were stained with Laurdan for 30 min. Cells were then imaged for MYADM-cherry (middle panel) and for the Laurdan intensity in two channels (400–460 nm and 470–530 nm). Laurdan intensity images were converted to GP images and pseudocolored using the indicated scale (left panel) to represent low-to-high GP values (see scale). The masked GP image corresponding to the membrane regions labeled for MYADM-cherry was then obtained (right panel). (B–E) Control MYADM KD cells or normal cells the cholesterol content of which was reduced by treatment with 10 mM methyl-β-cyclodextrin (mβCD) for 15 min were stained with Laurdan. The GP distribution obtained in each case is represented as pseudocolored images (B, top panels) or normalized histograms (C). In (C), The x-axis represents GP values, and the y-axis shows the percentage of pixels found for each GP value. An enlargement of the boxed regions is also shown (B, bottom panels). The GP and spreading area are presented in (D) and (E), respectively. The mean ± SEM from three independent experiments is shown (D and E). 16–20 images for each condition (16–20 cells per image) were analyzed in three independent experiments; *p < 0.05; ***p < 0.001.

