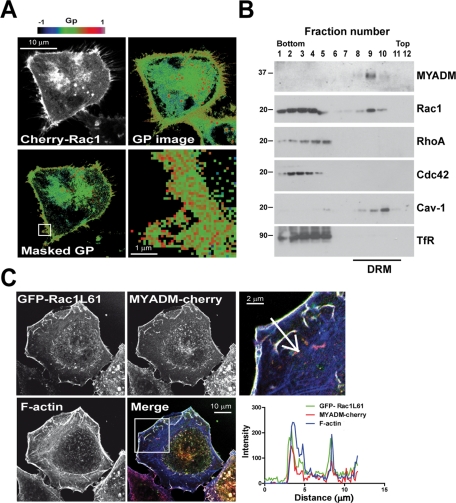
FIGURE 4:
Rac1 colocalizes with MYADM at the plasma membrane and accumulates into compact membranes. (A) HeLa cells transiently expressing cherry-Rac1 were stained with Laurdan for 30 min. Cells were then imaged for cherry-Rac1 (top right panel) and for the Laurdan intensity in two channels (400–460 and 470–530 nm). Laurdan intensity images were converted to GP images and pseudocolored using the indicated scale (top left panel). The masked GP image corresponding to the membrane regions labeled for cherry-Rac1 was then obtained (bottom left panel). An enlargement of the boxed region is shown (bottom right panel). (B) HeLa cells were extracted with 0.2% Triton X-100 at 4ºC, and the extracts were centrifuged to equilibrium in sucrose density gradients. The different fractions were analyzed for their content of the indicated proteins. The DRM fractions are indicated. (C) HeLa cells stably expressing MYADM-cherry were transfected with GFP-Rac1L61. After 24 h, cells were stained for F-actin and analyzed under a confocal microscope. An enlargement of the boxed region is shown. The plot shows the intensity of the staining of GFP-Rac1L61, MYADM-cherry, and F-actin along the line indicated by the arrow in the enlarged image.

