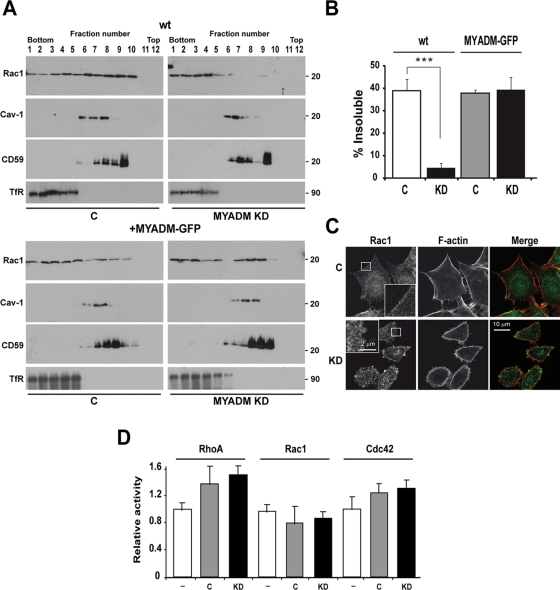
FIGURE 5:
MYADM KD inhibits recruitment of Rac1 into compact membranes and alters the distribution of Rac1 at the plasma membrane. (A) Control or MYADM KD HeLa cells stably expressing or not MYADM-GFP were extracted with 0.2% Triton X-100 at 4ºC, and the extracts were centrifuged to equilibrium in sucrose density gradients. The Rac1, caveolin-1, CD59, and TfR content of the different fractions was analyzed. (B) The histogram represents the percentage of insoluble Rac1 under the different conditions used in (A). (C) Control or MYADM KD cells were stained for endogenous Rac1 and F-actin. The insets show an enlargement of the boxed regions of the plasma membrane to illustrate the different pattern of distribution of Rac1 at the plasma membrane of control and MYADM KD cells. (D) The histograms show the levels of active Cdc42, Rac1, and RhoA in control and MYADM KD cells as determined in pull-down assays. The mean ± SEM from three independent experiments is shown in (B and D); ***p < 0.001.

