FIGURE 1:
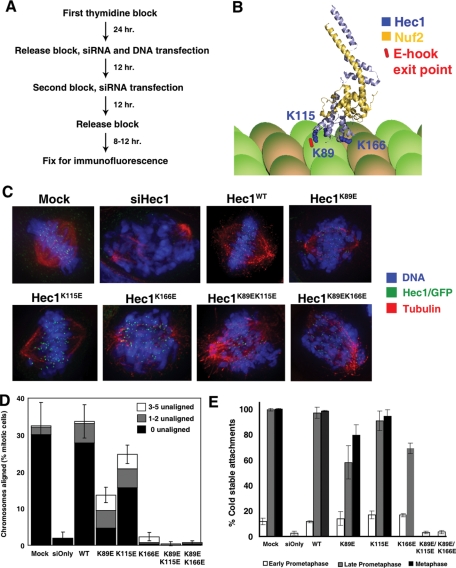
The CHD of Hec1/Ndc80 is essential for congression of chromosomes to the metaphase plate. (A) Scheme used to visualize the first mitotic division after endogenous Hec1/Ndc80 is replaced by exogenous Hec1/Ndc80 in synchronized HeLa cells. (B) Ribbon diagram depicting the N-terminal CHD regions of Hec1/Ndc80 (light blue, amino acids 80–285) and Nuf2 (yellow, amino acids 4–169). Lysine residues altered in mutants are shown in dark blue. The predicted exit point of a tubulin E-hook is indicated in red. Diagram was constructed based on the crystal structure of Ndc80bonsai (Cifferi et al., 2008) bound to a microtubule (Alushin et al., 2010). (C) Representative images of the predominant mitotic figures from siHec1 knockdown and rescued cells that have been stained for Hec1/Ndc80 (green), tubulin (red), and DNA (blue). WT and CHD mutant cells are identified by an expressed EGFP, and are costained for tubulin and DNA. For mock treated, Hec1WT, Hec1K89E, and Hec1K115E cells, representative metaphase images are shown. For siHec1(siOnly), Hec1K166E, Hec1K89E/K115E, and Hec1K89E/K166E, prometaphase cells are shown. (D) Mitotic cells were scored for chromosome alignment into a metaphase plate, and the percentage of metaphase cells was plotted. Metaphase cells were further subdivided to indicate cells with all chromosomes aligned (black), cells with one to two unaligned chromosomes (gray), and cells with three to five unaligned chromosomes (white). N = 3; 100 cells per experiment. Error bars = SD of total metaphase cell population. (E) Cells were incubated in ice-cold medium prior to fixation and immunostaining. Ten sister kinetochores from 5–10 cells (N = 3) were scored for kinetochore-embedded microtubules, and the mean percentage was plotted. Error bars = SD.

