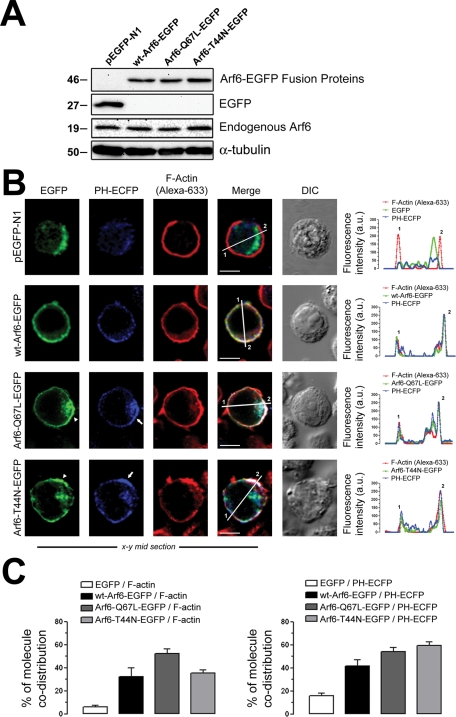
FIGURE 1:
Pattern of expression of endogenous Arf6 and Arf6-EGFP constructs on permissive lymphocytes. (A) Western blot analysis of endogenous Arf6, WT Arf6–, Arf6-Q67L–, and Arf6-T44N–EGFP expression in CEM-CCR5 cells. α-Tubulin and pEGFP-N1 are the controls for total protein and EGFP expression, respectively. (B) Left, a series of confocal images, x–y midsections, show the expression pattern for WT Arf6–, Arf6-Q67L–, and Arf6-T44N–EGFP molecules in CEM-CCR5 cells. PIP2 (PH-ECFP probe), F-actin (Alexa 633–labeled phalloidin), free EGFP distribution, and merged and differential interference contrast (DIC) images are shown. White arrowheads and arrows indicate Arf6 mutants and PH-ECFP plasma-membrane localization, respectively. Bar, 5 μm. Right, Arf6-EGFP constructs, F-actin, and PH-ECFP distribution were quantified along lines drawn through the diameter of the cells (1 and 2 indicate measurement points in merged pictures). (C) Codistribution quantification for each Arf6-EGFP construct or EGFP with F-actin (left) or with the PH-ECFP probe (right) in whole cells. Data are mean ± standard error of the mean (SEM) (n = 15 different cells).

