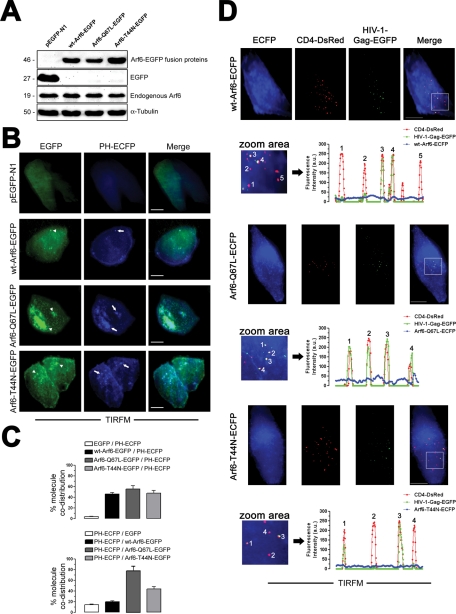
FIGURE 7:
TIRFM analysis for plasma membrane expression pattern of Arf6-EGFP or Arf6-ECFP constructs, and free or HIV-1–bound CD4-DsRed molecules on permissive HeLa cells. (A) Western blot analysis of endogenous Arf6, WT Arf6–, Arf6-Q67L–, and Arf6-T44N–EGFP expression in permissive TZMbl cells. α-Tubulin is the control for total protein. Free EGFP protein expression in pEGFP-N1–transfected cells. A representative experiment of the three is shown. (B) TIRFM analysis for the plasma membrane expression pattern of each Arf6-EGFP and the PH-ECFP probe. Merged images are shown. A representative experiment of the three is shown. Bar, 5 μm. White arrowheads or arrows indicate the distribution of Arf6 mutant or accumulation of PIP2-associated structures, respectively. (C) Quantification of the codistribution of each Arf6-EGFP or free EGFP molecule with PIP2 (PH-ECFP)–associated plasma membrane structures (top) or PIP2 (PH-ECFP) with each Arf6-EGFP or free EGFP molecule (bottom) from TIRFM images, as shown in (B). A representative experiment of three is shown. (D) A series of TIRFM images representing the expression pattern of cell-surface CD4-DsRed, HIV-1–Gag-EGFP virions, CD4-attached HIV-1–Gag-EGFP virions (merge), and WT Arf6–, Arf6-Q67L–, or Arf6-T44N–ECFP constructs, respectively, at the EF of TZMbl cells. The quantification of the pattern of distribution of free or HIV-1–Gag-EGFP–bound CD4-DsRed or Arf6-ECFP constructs is shown by line scan quantification, after background remove, through regions 1–4 or 5 indicated in zoom areas. Bar, 5 μm.

