FIGURE 6:
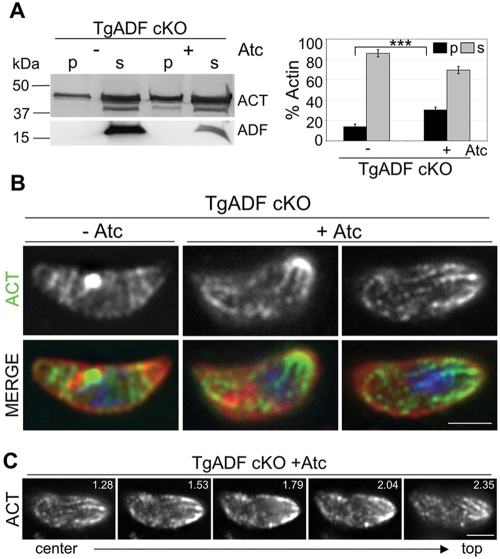
Effects of TgADF suppression on actin filament polymerization in T. gondii. (A) Sedimentation analysis of F-actin in TgADF cKO parasites grown ± Atc for 66 h. Parasite lysates were centrifuged at 350,000 × g for 1 h, and the pellet (p) and supernatant (s) fractions were analyzed by SDS–PAGE and quantitative Western blotting using antibodies against T. gondii actin and TgADF. Suppression of ADF was ∼90% in this case, but more typically ranged from 97% to 98%. Quantitation of the actin bands (ACT) by phosphorimager analysis is depicted on the right. Bars represent means ± SD (n = 3 experiments where suppression ranged from 90% to 98%), ***p ≤ 0.001. (B) Immunofluorescence analysis of actin in TgADF cKO parasites during gliding motility. TgADF cKO parasites were grown ± Atc for 66 h, harvested, and allowed to glide on coverslips before cells were fixed and stained with antibodies against T. gondii actin (shown in green) and the parasite surface antigen SAG (shown in red). Nuclei stained blue with DAPI. Suppression of TgADF resulted in cytoplasmic actin structures that were often concentrated at one or both poles of the parasite. Images were captured using wide-field microscopy and deconvolved using the nearest-neighbor algorithm. The micrographs represent a single slice taken from a z-stack. Scale bar: 2 μm. (C) Z-series of actin staining of a single TgADF cKO parasite from (B) treated with Atc, depicting the presence of actin structures in multiple planes of the parasite. Depth (in μm) of the depicted slice from the bottom of the parasite is given in the top right-hand corner. Scale bar: 2 μm.

