FIGURE 2:
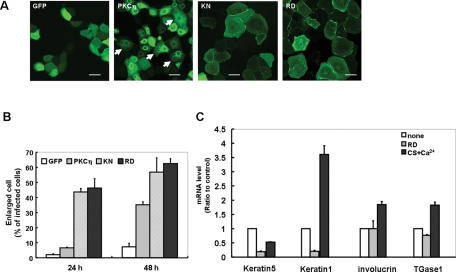
Effect of PKCη activity on keratinocyte morphology and mRNA level of marker proteins. (A) Confocal images of NHEK cells expressing KN- or RD-PKCη. The images were taken 24 h after infection. Arrows indicate the enlarged and flattened cell having typical punctuate localization of GFP-PKCη. Bars are 50 μm. (B) Static analysis of the effect of KN- or RD-PKCη on cell size. NHEK cells expressing KN-GFP, RD-GFP, PKCη-GFP, or GFP alone were cultured for 24 or 48 h without any stimulation, followed by the same procedure described in Figure 1C. (C) Effect of overexpression of RD on mRNA level of the marker proteins. The mRNA was extracted from NHEK cells 48 h after the infection with RD or treated with or without 50 μM CS and 0.12 mM CaCl2 for 48 h. Data points represent mean ± SE of three independent experiments.

