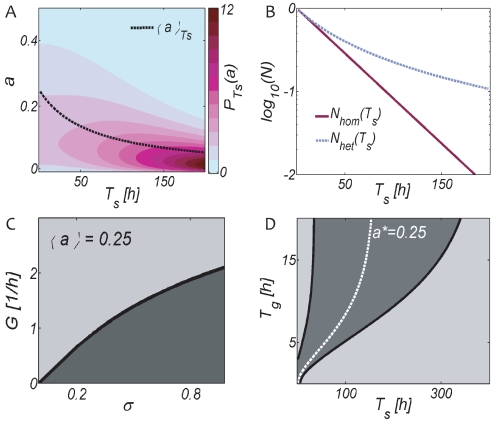
Figure 8. Costs and Benefits of resting state cell-cell variability.
(A) Change of the distribution of resting states  during stress for the initial parameters
  . Subpopulations potentially able to resume growth quickly (large
  ) rapidly decline upon stress exposure, resulting in a time dependent average activity (dashed black line) and death rate. (B) The population decay therefore deviates from the exponential decay of a homogeneous population. Panel (C) shows regimes in which cell-cell variability reduces (light gray,
  ) or enhances (dark gray,
  ) the population growth lag. At large steady state growth rates
  , population recovery is driven by the tail of the activity distribution with shorter than average growth lags. At small growth rates
  , or large variability
  , the recovery is driven by the bulk of the distribution with longer than average growth lags. Panel (D) shows regimes of benefits (light gray,
  ) and costs (dark gray,
  ) of cell-cell variability in full cycles of stress and regrowth. Heterogeneity represents a disadvantage when the population average is optimally adapted, i.e. when environments are sufficiently periodic and close to the white line compare with Fig. 5B. When environments fluctuate over a wide range, heterogeneous populations benefit from fast responders when the stress duration
  is short, and from highly stress resistant cells when
  is large.

