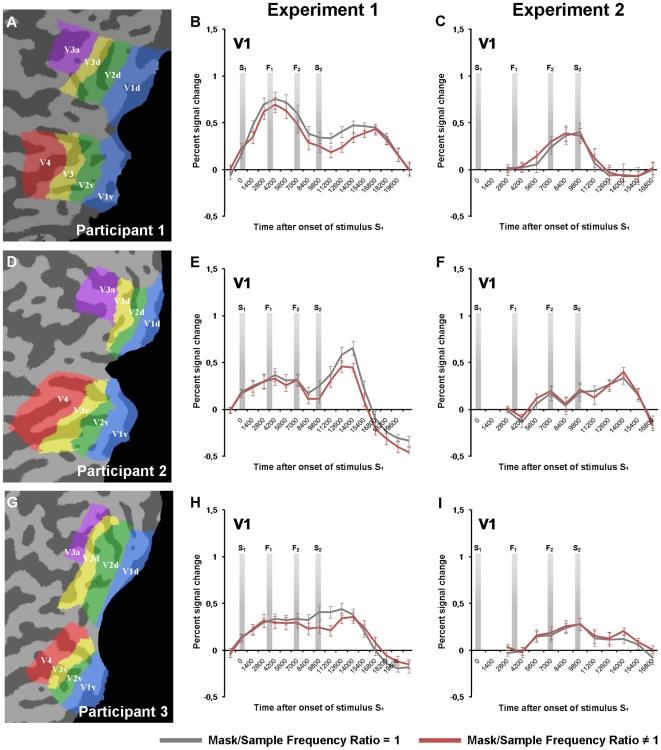
Figure 3. Event-related averages, V1.
A, D, G) Early visual areas investigated in the fMRI analysis. The figures show flattened representations of each participant's left visual cortex. Regions of interest (ROIs), representing voxels sensitive for the different stimulus locations used in the experiments, were defined separately across visual areas based on data from a separate localizer scan. B, E, H) Event-related averages from participant 1–3′s V1 ROIs in Experiment 1. The data shown here were extracted from V1 ROIs defined as voxels from the localizer data surviving a FDR <0.01 threshold (see the methods). All trials were included in the creation of the time series (corresponding to our statistical model 1).The vertical bars in each plot represent the stimulus onsets in a trial. C, F, I) Event-related averages from Experiment 2, extracted from the same V1 ROIs as for Experiment 1. Since stimulus S1 and S2 were presented to the opposite position of stimulus F1 and F2, the curves represent the activity from the V1 ROIs coding for the F1/F2-position. Error bars represent ±1 SE.

