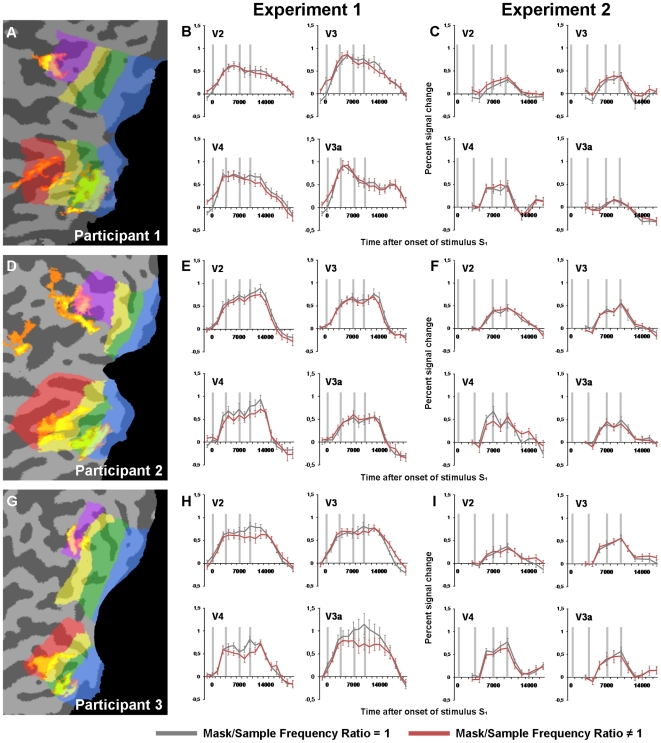
Figure 4. Event-related averages, V2-V3a.
A, D, G) Examples of activation maps from the ROI localizer scan. The activity clusters represent voxels sensitive to the stimulus position in the upper right visual field (thresholded at FDR <0.01). The resulting ROIs were defined as active voxels overlapping with the different visual areas. B, E, H) Event-related averages from the participants’ V2, V3, V4 and V3a ROIs in Experiment 1. The data shown here were extracted from ROIs defined as voxels from the localizer data surviving a FDR <0.01 threshold (similar to Figure 3). C, F, I) Event-related averages from Experiment 2, extracted from the same V2-V3a ROIs as for Experiment 1. Since stimulus S1 and S2 were presented to the opposite position of stimulus F1 and F2, the curves only represent the activity from ROIs coding for the F1/F2-positions.

