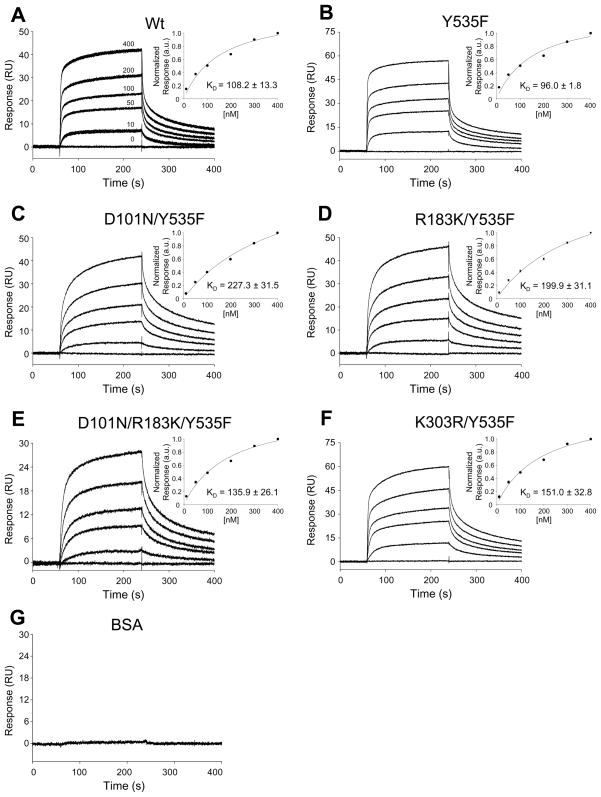
Figure 5. Binding of n-Src and NR2A C-tail proteins.
SPR sensorgrams in A–F show the binding of wild-type and mutant n-Src proteins at concentrations of 0 to 400 nM to NR2A C-tail protein immobilized on a CM5 chip to a surface density of 2000 RU. Sensorgrams in panel A are displayed as overlaid triplicate experiments, while panels B–G are displayed as single representative experiments for clarity. The degree of reproducibility of the respective B–G triplicate runs was similar to that shown in panel A. G: SPR sensorgram showing the binding of BSA at 400 nM (negative control). Insets in A–F: Summary data showing affinity curves fit to a one-site binding model derived from SPR binding curves normalized to the response at 400 nM (mean ± SEM for each concentration of n-Src protein); KD: (mean ± SEM) of steady-state binding constants (n = 6).

