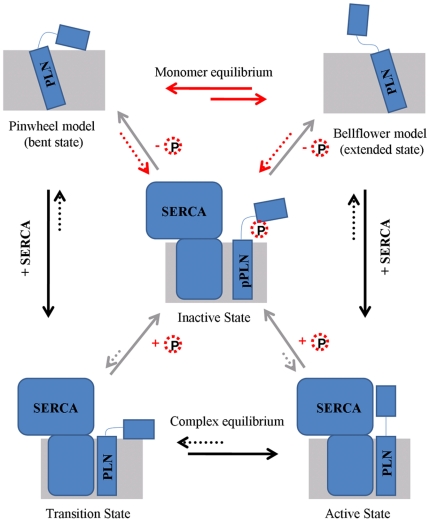
Figure 4. A proposed allosteric model for the regulation mechanism of SERCA by PLN.
In this figure, the membrane and PLN are represented by rectangles and colored in gray and blue, respectively. SERCA is shown in blue boxes. The arrows in black show the formation of SERCA-PLN complex. The gray arrows are for the phosphorylation and dephosphorylation. Reactions shown with red arrows are the processes we found in this study. Phosphoric group is represented by the red dotted circle.

