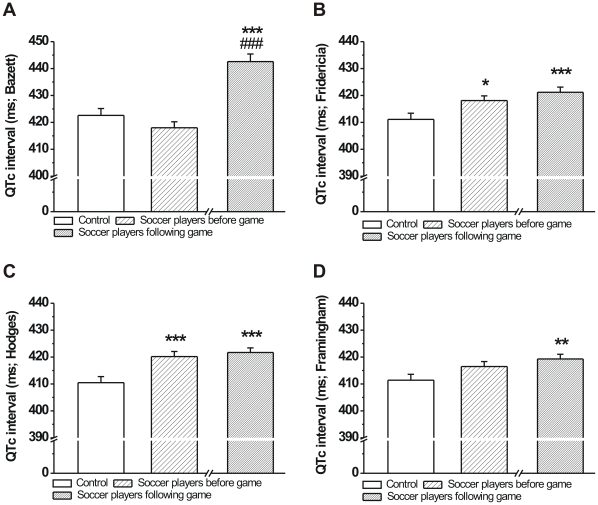
Figure 3. Frequency corrected QT interval of age-matched controls and professional soccer players before and following a competitive game.
QTc interval calculated with the Bazett formula was not different in soccer players before the game and was significantly prolonged after the game (A). QTc values calculated with the Fridericia and Hodges formulae but not the Framingham formula showed significant difference between groups before the game, and none of the three calculations yielded any difference between before and after game values in soccer players (B, C and D; n = 76 persons/group; Means ± S.E.M.; *p<0.05; **p<0.01; ***p<0.001 vs. age-matched control; ###p<0.001 vs. before game values).

