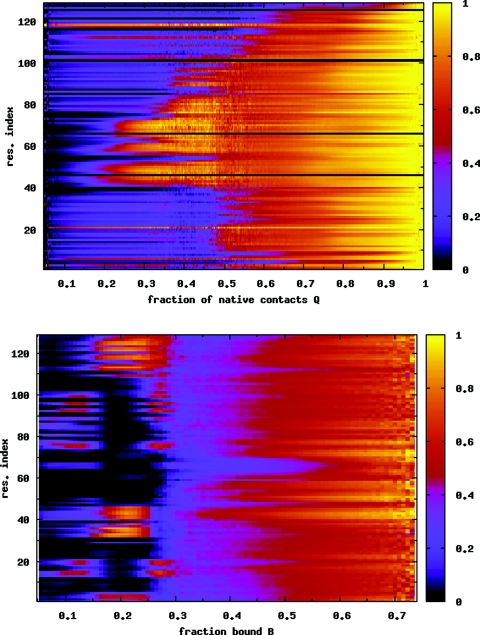
Figure 8.
(a) Average nativeness qi of each residue i as a function of Q, for the λ = 0.6 case. The folding behavior is very similar to the case of the isolated protein (Fig. 4) and the λ = 0.5 case (Fig. 6). (b) Probability of binding for each residue P(bi) as a function of B. Residues 62–70 in the β-sheet region have a low probability of binding. These residues also retain a large fraction of their native contacts [see (a)]. Data are averaged over temperatures T = 0.90–1.00 in both figures.

