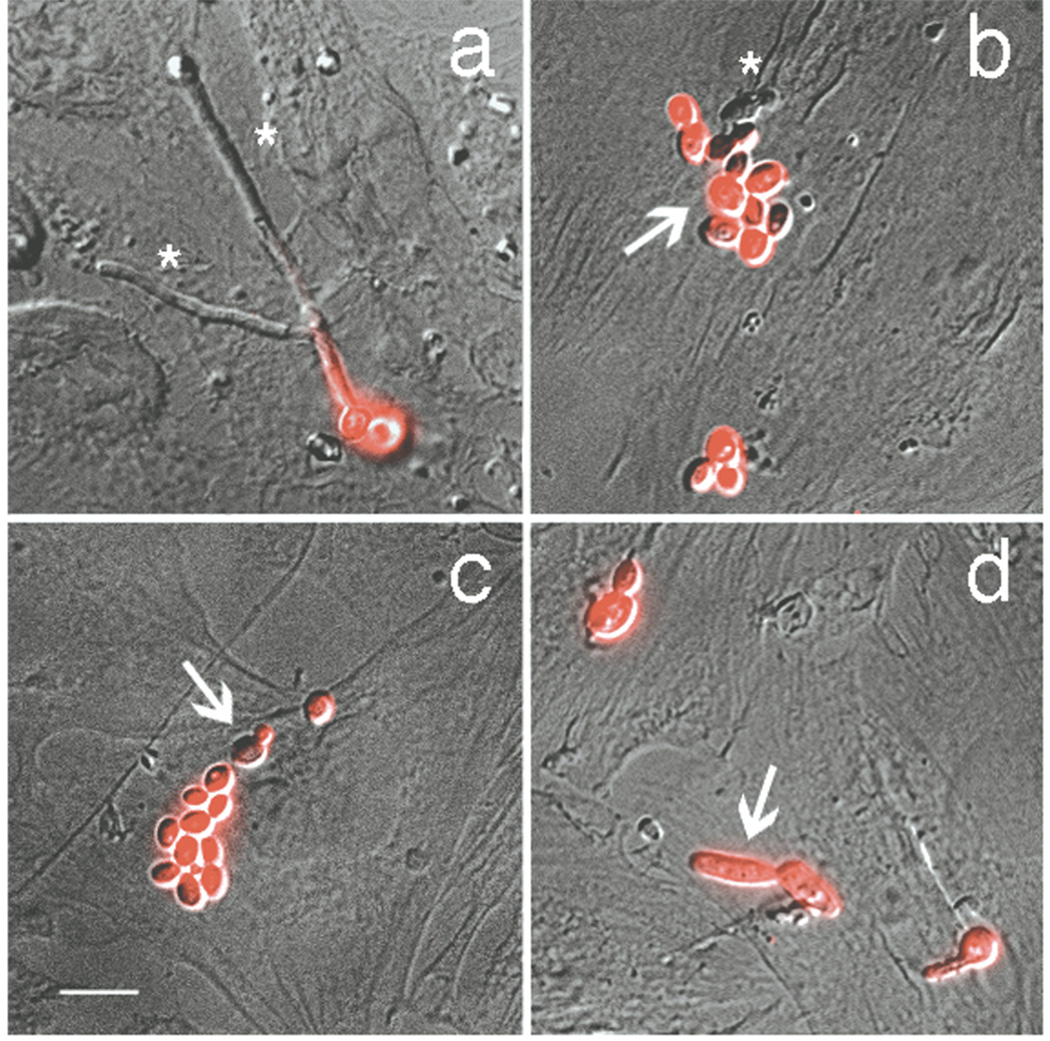
Figure 1.
Representative photomicrographs of H4 enterocytes inoculated with the Candida spp. used in the quantitation depicted in Fig. 2A. Z-stacks of DIC and fluorescence images were merged to obtain the images shown. Penetrating Candida cells lack fluorescent signal (asterisks). Non-penetrating Candida cells exhibit fluorescent signal (arrows). a, C. albicans SC5314; b, C. parapsilosis 4175; c, C. glabrata 4173; d, C. dubliniensis 10265. Scale bar, 10 µm.

