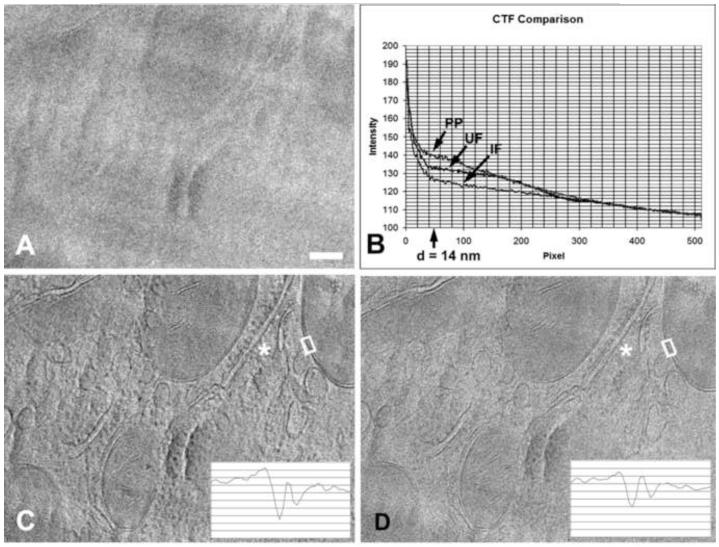
Figure 10.
Comparison of in-focus phase plate imaging and conventional high-underfocus imaging without phase plate. (A) Near-focus image without phase plate of a 200-nm-thick vitreously frozen cryo-ultramicrotome section of rat liver tissue. (B) Rotationally averaged power spectra of images A (IF), C (PP) and D (UF). The phase-plate cut-on spacing of 14 nm is indicated. Note improved low-frequency transfer with phase-plate imaging. (C) Near-focus image using a phase plate. (D) Image taken at 20 μm underfocus (corresponding to a spacing of 5.5 nm) without phase plate. Insets in C and D show traces across mitochondrial membranes within the white boxes on the images. Note the improved visibility of ribosomes on the endoplasmic reticulum at (*). Images recorded at 400 kV with zero-loss energy filtering. Bar = 100 nm.

