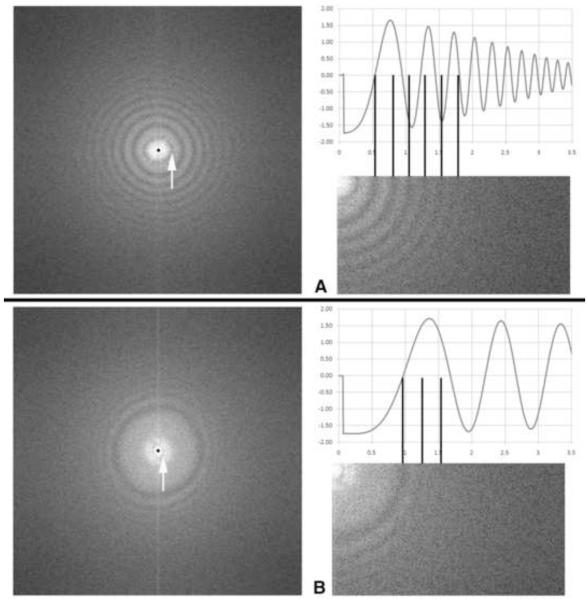
Figure 5.
Power spectra and calculated CTF plots of a phase plate that has acquired a charge. (A) Nominal underfocus 2 μm. The CTF minimum indicated by the arrow is characteristic of charging, and does not appear in a calculated CTF. The first “true” zero would indicate an underfocus of 1 μm, but note that the subsequent zeros are evenly-spaced, and do not correspond to a normal phase-plate CTF at 1 μm underfocus. This is another characteristic of charging (Danov et al., 2001). (B) The same phase plate with an applied overfocus of 3 μm relative to in-focus as determined by beam-tilt (e.g. the image wobbler). Again, the minimum close to the origin is a charging artifact. The first “true” CTF zero corresponds to an overfocus of 350 nm. Note that nevertheless there is strong contrast transfer to a spatial frequency of 0.5 nm−1, corresponding to a spacing of 2 nm. Thus, after using defocus to compensate for charging, this phase plate would be useable for moderate-resolution imaging. Images recorded at 400 kV with 0.14 nm pixel size; phase-plate cut-on frequency 16 nm (represented by tiny dots in the left-hand images), convergence angle about 0.5 mrad.

