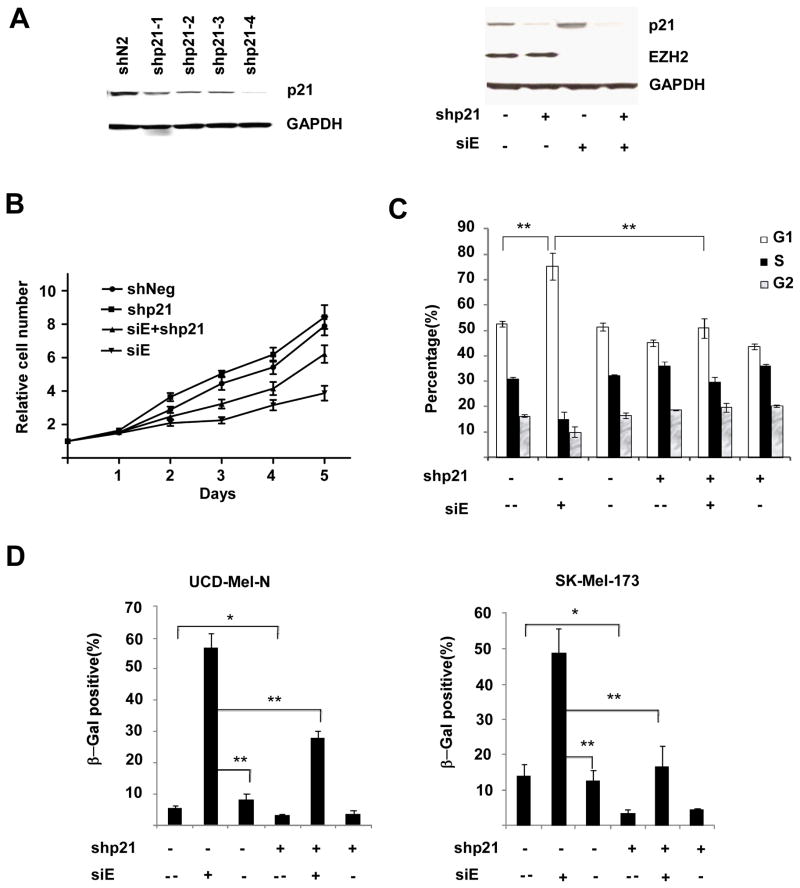
Figure 5.
Suppression of p21 inhibits the senescence phenotype induced by depletion of EZH2. (A) Left panel, suppression of p21 in UCD-Mel-N cells by shRNAs targeting p21/CDKN1A (shp21-1,2,3,4) or an irrelevant control shRNA (shN1). p21 and GAPDH (as loading control) levels are shown by Western blotting. Right panel, maintenance of p21 suppression in UCD-Mel-N cells stably transduced with either p21 shRNA (shp21 +) or a control shRNA (shp21 −) following transfection with EZH2 siRNA (siE +) or control siRNA (siE −). Western blot of p21 and EZH2 levels are shown with GAPDH as loading control. (B) Relative rates of cell proliferation of UCD-Mel-N cells stably transduced with either control shRNA or shRNA targeting p21 with or without transient depletion of EZH2. Cells were counted at the indicated number of days after transfection with control siRNA or siRNA targeting EZH2 (siE). Experiment was performed in triplicate with error bars representing standard deviation from the mean. (C) G1 cell cycle arrest induced by EZH2 siRNA can be partially inhibited by p21 suppression. UCD-Mel-N cells stably expressing shp21 (shp21 +) or shN1 (shp21 −) were either not treated (siE --), transfected with an siRNA targeting EZH2 (siE +), or transfected with a control siRNA (siE −) and cell cycle distribution measured. Error bars represent standard deviation of experiments performed in triplicate. ** indicates p < 0.01 for comparison by Student’s t-test. (D) SA-β-gal expression in UCD-Mel-N (left panel) and SK-Mel-173 (right panel) cells transfected with EZH2 siRNA (siE +) or control siRNA (siE −), or untreated (siE --), with or without stable p21 suppression (shp21 +, shp21 − respectively). Cells were stained, photographed under microscopy, and counted to determine the percentage of SA-β-gal-expressing cells. At least 1000 cells were counted in random fields in each of the duplicate wells. The results are presented as mean ± SD of three independent experiments. Differences were analyzed by Student’s t test, and differences with p value < 0.05 (*) and p < 0.01 (**) noted.

