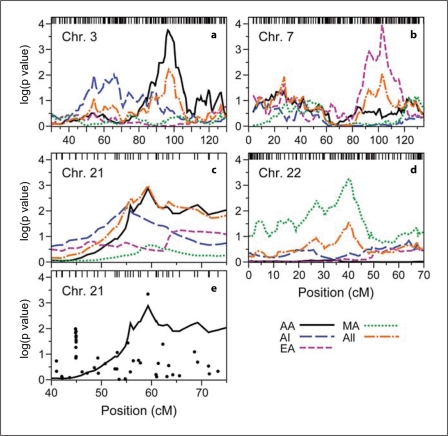
Fig. 4.
Detailed linkage and association results for ACR, on segments of chromosomes 3 (a), 7 (b), 21 (c, e) and 22 (d). Axes and lines are as in figure 2. In panel e, results from association analysis for the AA sample are shown (·) with the AA linkage profile from panel c.

