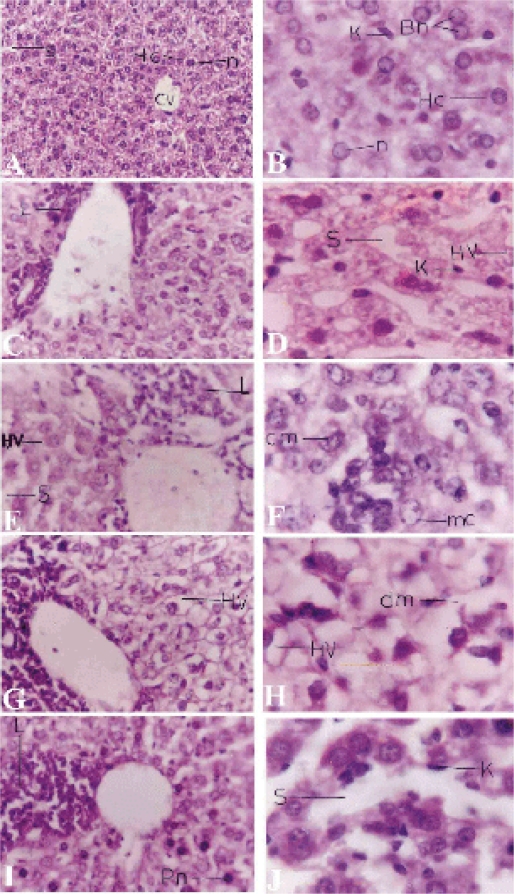
Figure 1.
Light micrograph of the liver sections. A,B Control liver with central vein (CV) and surrounding hepatocytes (HC), sinusoids (S) lined with Kupffer cells (K). C,D T1 group liver sections treated with piroxicam for one week with inflammatory cellular infiltrations (L) around the hepatic vein, dilated blood sinusoids (S), hepatocytic vacuolations (HV) and prominent Kupffer cells. E,F T2 group liver sections treated for 2 weeks appearing with hepatocytic vacuolations, inflammatory cellular infiltration, dilated sinusoids. In the higher magnification marginal chromatin (mc) pattern appear in some hepatocytes and clumped chromatin (cm) in others. G,H T3 group liver sections treated for 3 weeks with increased inflammation and vacuolation. I,J T4 group treated sections for 4 weeks appearing with more inflammatory cells, some pyknotic cells (Pn), widened sinusoids and numerous Kupffer cells. Sections were stained with hematoxylin-eosin. Magnifications, X400 (A,C,E,G&I) and X1000 (B,D,F,H&J).

