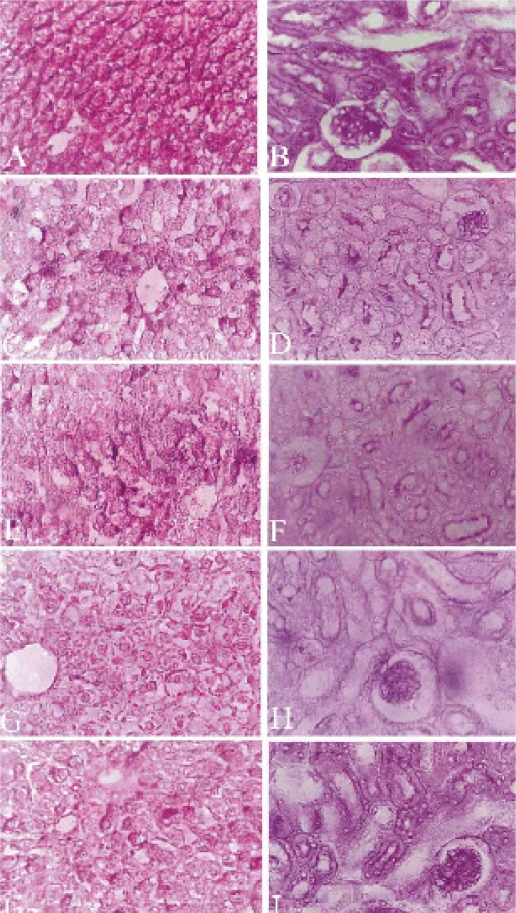
Figure 3.
Light micrograph of the liver (A,C,E,G&I) and kidney (B,D,F,H&J) sections showing the distribution of glycogen. A Control liver, glycogen in hepatocytes with intense red color, nuclei have no stains. C T1 group liver section with a slight decrease in glycogen. E T2 group with apparent decrease of glycogen. G T3 group with a severe decrease in glycogen. I T4 group with a marked decrease in glycogen. B Control kidney section with moderate PAS positive material in the cytoplasm and brush borders of the proximal convoluted tubules. Glomeruli were intensely positive to PAS reaction. D,F,H&J are T1,T2,T3&T4 groups respectively with a decreased amount of PAS positive material in tubules and glomeruli. Sections were stained with periodic Schiff's method. Magnifications, X 400.

