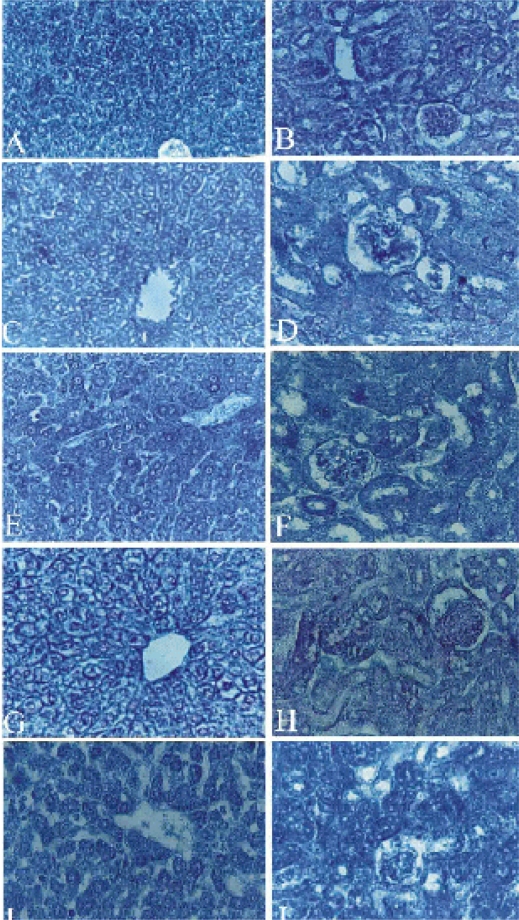
Figure 4.
Light micrograph of the Liver (A,C,E,G&I) and kidney (B,D,F,H,&J) sections showing the protein content. A Control liver with a considerable amount of protein elements in the cytoplasm of hepatocytes. C T1 group liver section with a weak response towards bromophenol blue reaction. E T2 group with a decreased protein content. G T3 group with a very low amount of protein content, although the stainability of plasma membrane increased. I T4 group with a decreased amount of protein. B Control kidney section with homogenous dense blue colored granules as their positive affinity to bromophenol blue. D,F,H&J are T1,T2,T3&T4 groups respectively with increased protein content. Sections were stained with bromophenol blue method. Magnifications, X 400.

