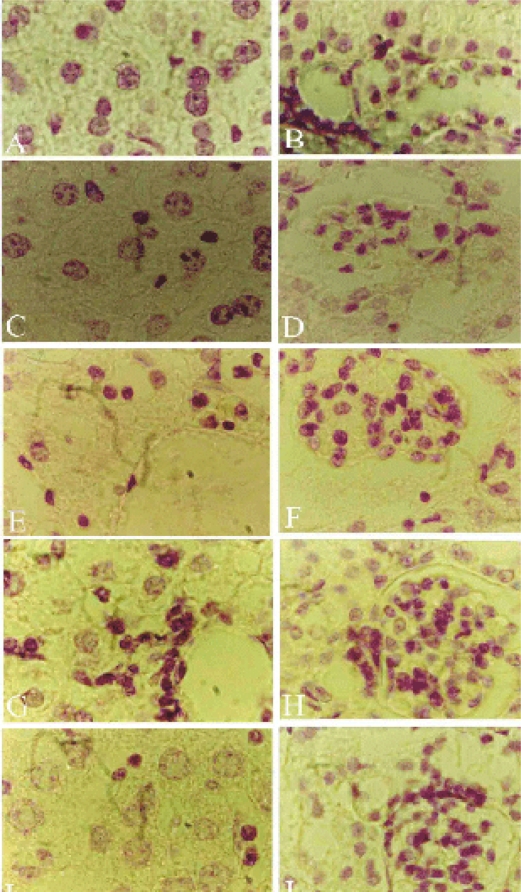
Figure 5.
Light micrograph of the Liver (A,C,E,G&I) and kidney (B,D,F,H&J) sections showing the DNA content. A Control liver with a faint red purple colored particles in the nucleoplasm of hepatocytes and Kupffer cells. C T1 group liver section with increased coarse chromatin. E T2 group with a moderate reduction of coarse chromatin, densely stained nuclei of the Kupffer clls and inflammatory cells. G T3 group with a decreased amount of DNA content. I T4 group with a very low amount of DNA in hepatocytes and darkly stained nuclei of the inflammatory cells. B Control kidney section with DNA particles (chromatin) appeared as faint red purple color. D,F,H&J are T1,T2,T3&T4 groups respectively with decreased DNA content in tubules while increased stainablity of mesangial cells. Sections were stained with Feulgen method. Magnifications, X 400.DISCUSSION

