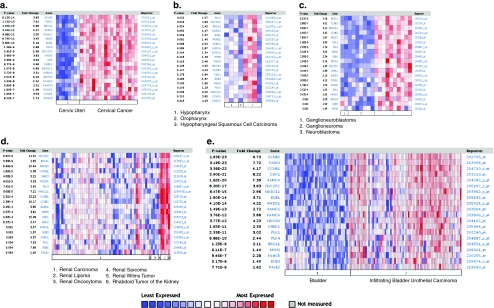
Fig. 3.
Oncomine analysis of DNA repair genes and “death-from-cancer” genes in other cancers. The heat maps represent raw data from the a number of studies comparing gene expression levels of DNA repair genes in normal tissue and cancer tissues, as well as more aggressive forms of a number of the cancers shown. The p value represents Student’s t test comparing primary and metastatic expression. The fold change in expression, the gene name, and the reporter ID from the position on the array are provided as well. Genes demonstrating increases in cancerous tissues are shown in red. Studies were conducted by Pyeon et al. [82] in the cervix (a), Schlingemann et al. [83] in the head and neck (b), Albino et al. [84] in the brain (c), Yusenko et al. [85] in the kidney (d), and Sanchez-Carbayo et al. [86] in the bladder (e)

