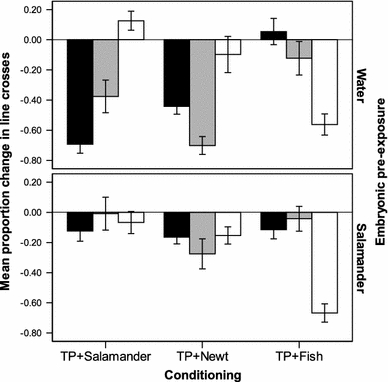
Fig. 1.

Mean (±SE) proportion change in line crosses from the pre-stimulus baseline for woodfrog tadpoles exposed to salamander odour (black bars), newt odour (grey bars) or fish odour (white bars), 1 day after being conditioned with crushed tadpoles paired with salamander odour (TP + Salamander), newt odour (TP + Newt) or fish odour (TP + Fish). Embryonic woodfrogs were exposed to water or salamander odour for 6 days
