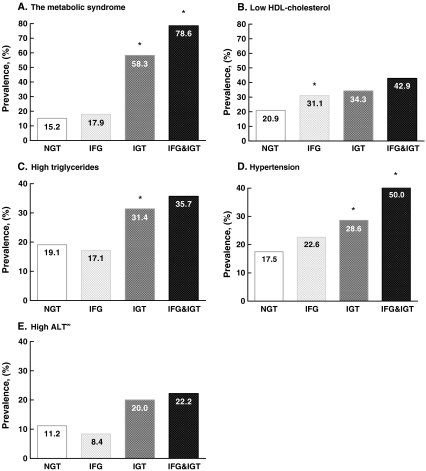
Fig. 2.
Prevalence of the metabolic syndrome, hypertension, low HDL cholesterol, high triglycerides and high ALT according to glucometabolic status; normal glucose tolerance (white bars), impaired fasting glucose (light grey bars), impaired glucose tolerance (dark grey bars) or presence of both (black bars). *P < 0.05, ∞ N = 657

