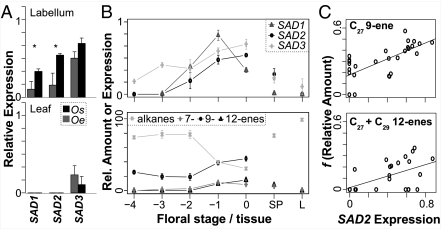
Fig. 2.
SAD expression and hydrocarbons. (A) Mean relative expression of SAD1–SAD3 in O. sphegodes (Os) and O. exaltata (Oe), normalized to G3PDH control, in flower labella (Upper), and leaves (Lower). *P < 0.05 (one-way ANOVA). Error bars indicate SEM. (B) Normalized expression of SAD1–SAD3 (Upper) and relative amounts (%) of major hydrocarbon classes (Lower) in O. sphegodes flower labella of different developmental stages (−4, smallest bud; 0, flower at anthesis), mature sepals/petals (SP), and leaves (L). Error bars indicate SEM. (C) Correlation of normalized O. sphegodes SAD2 expression with relative alkene amount after f(x) = arcsin x0.5 transformation, for 27:1Δ9 alkene (Upper; adjusted R2 = 0.48, P = 2.8·10−5), and 27:1Δ12 + 29:1Δ12 alkenes (Lower; adjusted R2 = 0.32, P = 0.0009), showing regression lines.

